Technical Resources
Educational Resources
APM Integrated Experience
Connect with Us
Last updated: October 2024
Apache logs can be a valuable tool for any software developer or anyone with a web application. Apache plays an important role by giving you necessary information about your web operations from the server, such as traffic volume, errors, and server performance metrics. The information you get from the Apache web server can help you improve your website. The error message logs can help make troubleshooting your web application easier.
One use case for these logs is to check traffic volume. Knowing your website traffic can be useful, giving you information to help you decide whether to scale your website hosting resources. You can use these logs to optimize your website and improve its performance; fast websites are generally preferred over slow ones.
There are many ways you can monitor Apache logs. Some of them are tricky, and you’ll need some basic understanding of working with a Linux-based environment. If you don’t have a basic understanding of Linux, in this post, I’ll give you some options to make it easier.

One approach to monitoring your Apache logs from the server is by using Unix command-line tools. Many developers and systems admins use this method. Even though writing Unix commands might not be easy, using this approach does the job. And although Unix commands won’t give you a graphical representation of the logs, you’ll be able to get the desired results. These commands are completely free and ready to use.
You can access Apache logs from var/log/log_type. For example, you can access Apache logs from the Apache Unix/Linux server by looking in the following directories:
On a Linux server, you can access Apache error logs from var/log/apache2/error.log. You can then log out the errors from the error log file by writing the following command: sudo tail -f /var/log/apache2/error.log. When you run this command, you’ll be able to view the errors in the terminal as they occur in real time. The tail command tells the machine to read the file and display the results on the terminal. You can use these errors to monitor the operations on your website and better troubleshoot issues occurring on the web server.
As you may have noted, we’re passing the -f flag in the command. This flag helps to ensure the tail command outputs additional data from the log file. If this flag is left out, you might not gather every detail about the log file.
As with accessing error logs, you can also monitor access logs by running the same command mentioned previously. Access logs are lists of the files your users (or bots) are requesting from your website and all the processed files. Access logs are commonly used to monitor a website’s performance. You can also use them for security reasons, as they store all the requests sent to the server. Access logs help you see what’s being requested and where it’s coming from.

For better results when logging in Apache, Apache lets you separate log messages into categories, so you receive only the log messages you need to work with or see. For example, if you want to log information messages only, you can set the level in the Apache configuration file and receive messages at the info level. Here’s an example of how you can do this:
sudo nano /etc/apache2/apache2.confAnd you can set the Apache log level to info:
...

LogLevel info

...
With this configuration in place, you’ll receive useful information from the Apache server. If you want to receive serious messages, like errors, just set the LogLevel to error.
You can actually combine two commands to get the best results. When you’re using tail and grep, these commands give you the power to monitor a specific type of data from a log file. Now this is awesome—you don’t have to see unnecessary messages coming from the server. Here are some scenarios where you might need to combine tail and grep commands.
If you want to get log messages from a certain IP address, you can simply run this single line of command and get information from a specific IP address:
tail -f /var/log/apache2/access.log | grep 192.168.206.1The combination of these commands will match the partner you want. This allows you to watch requests from only the IP address you’ve specified (in the above case, 192.168.206.1).
When you’re monitoring Apache logs, you’ll be able to see many unwanted files being logged on the console. This can make your job difficult, but there’s a way out. What you must do is exclude some of the files you don’t really need from the log message. If you don’t need to watch things like images, you can run a command like this:
tail -f /var/log/apache2/error.log | egrep -v "(.gif|.jpg|.png|.swf|.ico)"Thanks to egrep, you won’t be watching unnecessary images. This will give your log messages a cleaner look, making it easier to spot errors.
In the same way, if you want a specific file, you can simply run this command: tail -f /var/log/apache2/error.log | grep .png. Doing so means you’ll be monitoring only logs with .png file types. Using commands and a console to analyze data can be challenging, especially in larger environments with many logs and a high volume of log data, but there are tools to help you view data in a user interface UI.
It can be challenging to read monitor log messages on a console; it may be noisy and have little signal. It’s typically easier to view these log messages in a simple way, making it easy to spot the problem from the server. Using software can give you the ability to make these log messages more readable and get an alert so you can act on your business needs.
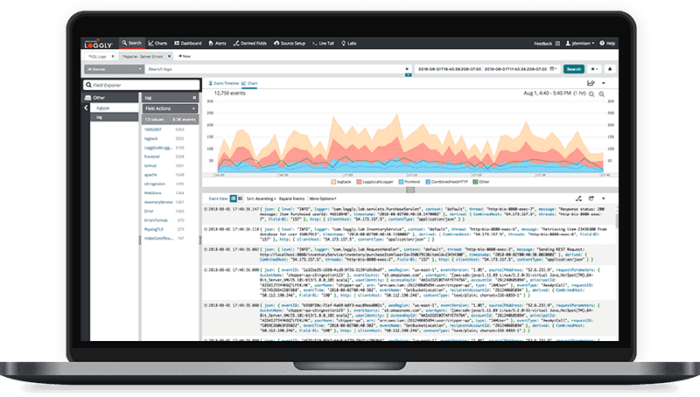
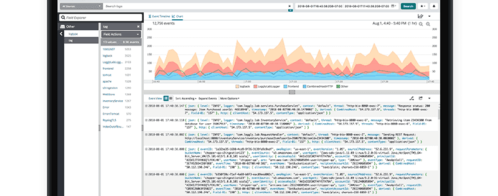
SolarWinds® Observability system, for example, helps you monitor Apache logs and can alert you if problems arise. SolarWinds Observability provides holistic visibility across your IT environment and connects log data to performance data from servers, applications, networks, and user activity to simplify troubleshooting issues. This means you can act quickly, before business is affected. SolarWinds Observability provides various visualizations and drill down views, enabling you to quickly detect and understand the problems arising in your environment. You can start your free trial here and start monitoring Apache logs today.
Apache logs, including error and access logs, are typically stored in specific directories on the server where Apache is installed. The exact location can vary depending on the operating system and configuration of your Apache server. The logs help you monitor server activity, diagnose issues, and understand visitor interactions.
If you’re interested in exploring where you can find your Apache logs—both error logs and access logs—across various operating systems, the following guide may help.
Error logs record information about your server errors, warnings, and critical events. They’re invaluable for troubleshooting issues with your Apache server.
You can usually locate these logs in such directories as /var/log/apache2/ on Linux or /usr/local/apache/logs/ on other systems. Look for a file named error.log or error_log, and you’ll find the scoop on any glitches your server’s been dealing with.
Access logs let you track every request made to your Apache server, including visitor IP addresses, requested URLs, and response codes.
These logs reside in the same location as the error logs and often in the same directories. Keep an eye out for files named access.log or access_log. Each line in these logs tells you who visited the site, their location, and which pages they checked out.
In summary, understanding where to find and how to access Apache logs can be crucial for server administration, troubleshooting, and security monitoring. Regularly reviewing these logs can provide you with insights into your web server’s health, performance issues, security threats, and visitor behavior, helping you maintain a reliable and secure web server environment.
Logs provide data you can use to offer the best user experience. One error can cause a business to lose sums of money. Acting quickly to solve the issue is key, and the only way you can know about these errors before your users do is by logging the error messages—or any other logs you desire to work with.
This post was written by Mathews Musukuma. Mathews is a software engineer with experience in web and application development. Some of his skills include Python/Django, JavaScript, and Ionic Framework. Over time, Mathews has also developed an interest in technical content writing.
Want something different? Try the SolarWinds Apache Log Analyzer