Technical Resources
Educational Resources
APM Integrated Experience
Connect with Us
Whether you’re conducting a technical SEO audit or poring over weekly metrics for your site, analyzing your web server’s logs can provide clues and insights for improving SEO. Every connection to your web server, every webpage visit, and the amount of time it takes to send data to clients is recorded in this log data, which is invaluable when trying to understand how you can improve the user experience of your site and how your site ranks in search engine results pages (SERPs).
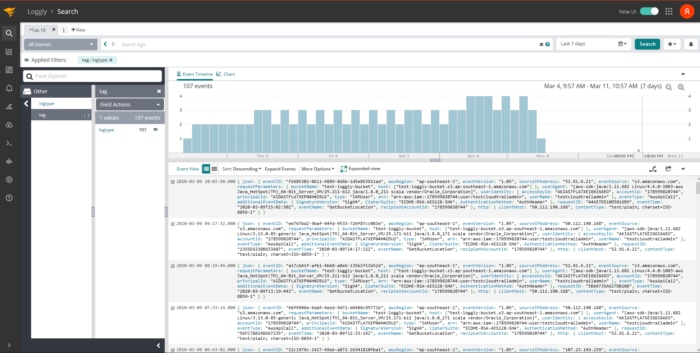
Successful and unsuccessful resource requests from clients are logged in your web server’s access and error logs, and mining this data effectively requires the help of a powerful log file analysis tool like SolarWinds® Loggly®. Loggly knows how to automatically parse and analyze logs from popular web servers such as Apache and NGINX. It provides features to make searching through logs easy, allowing you to visualize your log data over any time period.
In this article, I’ll cover how to use Loggly to extract details from your logs, which you can then use to improve your SEO.
When the Google or Bing crawlers index your website, they use a crawling algorithm to map the layout of your resources. But some websites are built from a maze of internal links and have a huge number of pages and images, so the crawler needs a way to limit the length of time it spends on your site. Doing so gives it a chance to crawl other sites. This limit is implemented with a crawl budget, which is the number of pages it’ll crawl before moving on to another site. Any pages the crawler didn’t get to won’t be indexed and won’t appear in SERPs. Your crawl budget may be spent on pages without much content or ones not contributing much to your overall rankings.
Crawl budgets vary for different sites because the allocated budget is determined by your site’s domain authority—the more authoritative the domain, the more pages crawled.
To see which crawlers are visiting your site, you can inspect the User-agent field of recorded page requests. Here’s an example of this:
"Mozilla/5.0 (compatible; Googlebot/2.1; http://www.google.com/bot.html)"Loggly comes with automatic parsing capable of extracting Apache and NGINX fields—including User-agent—from your logs. By pairing the User-agent field with the Urlpath field, you can gain insights into which pages the search crawlers are visiting and which ones they aren’t. If the crawler is finishing without visiting all the pages on your site, your crawl budget may be exhausted. If this is the case, consider deleting some of your lower-quality pages.
HTTP status codes can provide clues about the health of your website. The most severe status code is 500, a server error. If you or your users are seeing these codes when browsing your site, something is wrong with either the server hosting your website or the configuration, and users won’t waste any time returning to the search engine results page and looking for a different site. 404 HTTP status codes are generated when a user tries to visit a nonexistent page, and while these are more acceptable than 500 errors (the error is local to a page instead of potentially affecting the entire site), it still means the user wasn’t able to find what they were looking for.
Lastly, excessive use of redirection (HTTP status codes 301 and 302) can ruin the user experience of your site because it takes time to receive and process redirections—no one likes to wait for pages to load.
Poor user experience is just one of the reasons users will hit the back button in their browser, but it’s an important one to consider when looking at SEO. Fortunately, you can easily track how many 500, 404, and redirection status codes users are seeing when they browse your site by searching through your logs for the relevant HTTP status codes.
Log analysis tools like Loggly allow you to parse web server logs and group 404 errors by cause, helping you see which resources don’t exist and summarizing how many requests there were for each resource. This allows you to see which one is causing the most errors.
Every content or SEO audit involves culling infrequently visited pages because keeping them around wastes valuable time and energy, but some judgement is required for this step. If one of your pages isn’t visited often but contains content you think is insightful and useful for your users, it’s possible the page simply doesn’t rank well for your targeted keywords. In this case, instead of deleting the page outright, you may want to merge the content with another page to produce an even better page. Of course, if the page isn’t visited often because it’s thin on content and not useful, you’re better off deleting it.
So how do you find out which pages aren’t getting much traffic? Loggly can produce charts showing the least frequently visited pages with a breakdown by URL. Loggly can even show you how these values change over time by adjusting the time period you’re looking at.
User experience is a critical component of SEO because users don’t like visiting pages that take a long time to load. In a way, slow sites are worse than sites with 404 errors—it’s not immediately obvious there’s a problem, but things still work slowly. And this makes for a frustrating experience.
Understanding this important metric is possible because web server log files contain the time each request took, allowing you to calculate statistics for average, minimum, and maximum page load time and diagnose which pages are experiencing long load times.
Loggly allows you to extract this information and create visualizations, and these visualizations make it easier to detect patterns and trends over a time period of your choice. Once you have an idea of what your average request latency is (or if you’ve got a target request latency specified in an SLA) you can filter out all page requests below the threshold and display pages and resources that took longer to send to the client.
Understanding the behavior and performance of your web server is essential to identifying how users are coming to your site from search engines and the steps you can take to improve SEO. The key to this understanding is in-depth log analysis using web server logs.
Actionable insights capable of helping you improve your SEO game are buried inside your web server logs, and almost everything you need to improve SERP rankings and user experience are contained in these log messages. Leading log analysis tools like Loggly have features designed to automatically parse popular web server log formats, calculate statistics for the most visited pages along with their load times, and visualize data to make it easier for you to notice patterns and trends over time. Remember, the first step to improving your SEO tomorrow is understanding your traffic today.
Didn’t find what you were after? Consider the SolarWinds Log Analyzer