Technical Resources
Educational Resources
APM Integrated Experience
Connect with Us
Monitoring and analyzing an application server’s logs is essential to ensure the efficiency of applications functioning on a server. Additionally, these measures provide support to resolve or prevent potential issues in a timely fashion.

Tomcat is the most common web server in use, with most of its users being Java developers. However, it has some log management challenges. For example, monitoring and troubleshooting can be an issue if you try to find a solution by looking through hundreds of lines of code, so a log management strategy is vital. This post will first help you learn about Tomcat and its logs, including different types of log files and performance metrics used in log monitoring. Then we’ll briefly cover a tool designed to make monitoring and troubleshooting Tomcat logs easy.
Tomcat is a web server provided by the Apache Software Foundation. The server is built up by Catalina (servlet), Jasper (JSP), Cluster, and Coyote (connector). The main purpose of Tomcat is to send HTTP requests and return the dynamically generated response to the correct place.
Connectors are links used to establish a connection with the outside world, which allows the Catalina engine to receive requests. Thereafter, links are transferred to a relevant web application and return a response via connectors, providing consistent content.
Otherwise known as a request processing pipeline in the Tomcat server, the engine controls data received by the connectors. However, static pages directly involve processing from the server’s cache, and JSPs and servlets serve dynamic pages by the Tomcat engine.
Connection pooling allows applications to interact with the back-end database to deal with queries in the Tomcat server. This component reduces the load on the server database and improves application response time by not opening the connections separately for each request.
Context acts as a web application. Each Tomcat server may consist of multiple web applications, resulting in various contexts. Tomcat servers are based on Java virtual machine (JVM) as it’s used for threading, memory management, garbage collection, etc.
When we speak of log monitoring, we often mean different things. For this reason, we should break up the term into three parts—namely log collection, log management, and log monitoring itself.
Log collection involves filtering through the logs provided by Tomcat. Log management refers to data retention, access control, and things concerning the performance of logs. Lastly, log monitoring concerns how to display logs to the user.
Tomcat logs provide insights into what’s happening inside a web application. This can include risks and server configuration, for example. But it isn’t easy to find this information because it may be hidden among a high volume of log messages, leading to sub-optimal analysis task management. With an optimized log monitoring setup, you can efficiently extract insights from Tomcat logs to counter risks proactively.
The alternative is to manually parse logs, which is very inefficient and hinders your troubleshooting efforts. Furthermore, monitoring Tomcat logs is used to manage the performance of a web app. Performance quality can be quantified according to different metrics.
Memory usage: If your application has low heap memory, it will affect performance. However, inefficiently using available memory can also negatively affect performance elsewhere, so balance is crucial.
Garbage collection: This involves managing memory by removing objects no longer being used by the application. It’s a resource-intensive process, so it’s imperative to run the garbage collection at the right frequency. Again, a balance between freeing up un-used memory, and the cost of doing so needs to be struck.
Thread usage: Ensure you monitor the amount of active threads running. Running too many threads at the same time can also affect performance and ultimately slow down your app.
Request throughput: This measure demonstrates the number of requests the server can process at a given time. This is a critical measure of success for the application itself—how much work the system is accomplishing.
Number of sessions: Just as the request throughput measures the number of requests at a given time, the number of sessions metric refers to the number of sessions the server can handle at a given moment.
Response time: This measure is crucial to your users’ experience. If your server takes too long to respond to requests, this will negatively affect UX.
Database connection pool: This measure is important to monitor as it can help find the best number of connections in a pool your application requires.
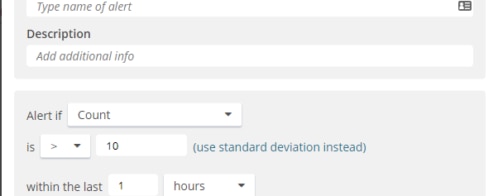
Error rates: This refers to issues in your code.
The different types of log files in Tomcat often confuse users. To find further detail about them, look in the directories entitled conf/logging.properties and conf/server.xml for the access logs. But, in summary, the following are the default types of log files generated in the Tomcat logs directory.
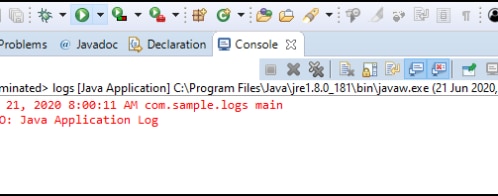
catalina.logThis file involves all log messages written to the Tomcat system.err and system.out stream. Tomcat logs’ internal statements use java.util.logging package (Juli) for logging. Standard.out is the default landing place for that log. Furthermore, Catalina.log entries show the server activity.
catalina.outThis log file exists on the computer hosting the Tomcat server instance. Each server instance contains its own Catalina.out log file. This file is located in the logs directory below the Tomcat root directory. This log is the system’s output log, which also consists of standard error messages.
These files are saved daily (MM-DD-YYYY) with the date appended to the name of the data. Moreover, this log file persists during the functioning of the server.
localhost.logThis file tracks web applications activity. It monitors HTTP transactions between the application server and the client.
localhost_access_log.txtThis log functions for tracking data requests generated by the server. It contains details about IP address, request method (POST or GET), time, and requested resource.
Host-manager.log and Manager.logThese two Tomcat logs are also monitored to access specific information to prevent and reduce user risks. Analysis by receiving message logs from specific log files through simple scripts simplifies the log management and removes errors.
To find more information on logging, please visit this site.
It’s important to have a good log monitoring strategy to efficiently monitor your logs.
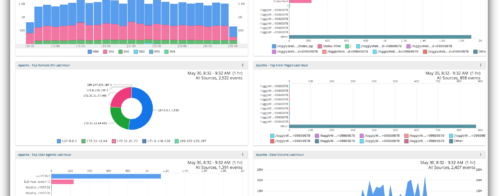
Tools can make this easy for you. One such tool is SolarWinds® Loggly®, which enables you to parse through your logs quickly as it provides an organized visualization.
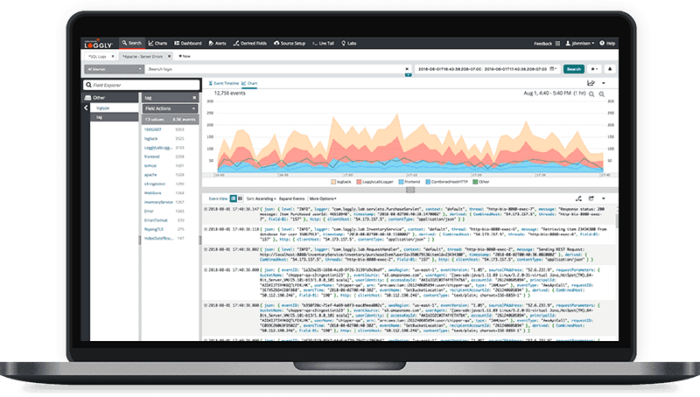
Furthermore, Loggly allows you to collect all records in one place, analyze them, and process them for visualizations and queries. You can learn more about it here.
This post was written by Daniel de Oliveira. Daniel is a full stack developer and analyst, experienced with Java, Angular, and Flutter.
Didn’t find what you were after? Consider the SolarWinds Geronimo Tomcat Monitor