Technical Resources
Educational Resources
APM Integrated Experience
Connect with Us
NGINX is the beating heart of your web application. Before a request goes to the code that eventually handles it, it passes through NGINX. In my experience, many companies treat NGINX as an afterthought. They neglect to set up things like NGINX monitoring, assuming they’ll “just know” when something goes wrong. While you’ll know if something goes wrong with NGINX, it’s not the best idea to leave the monitoring of your website’s status to your customers. For many, this laid-back attitude extends to their application logs. Developers and operations specialists assume logs are for troubleshooting issues. More mature organizations understand logs can tell you about things well before they go wrong and impact users, meaning the first time you hear about the problem ’won’t be from an angry customer.
Sometimes, companies neglect NGINX monitoring because they don’t think NGINX logs are useful. Sometimes, they ignore it because they think there’s too much data to sift through. Whatever the reason, tackling NGINX monitoring head-on means your website will be more stable, and your customers will be happier. In this post, I’ll review what NGINX monitoring looks like, why it’s important, and how to search effectively.
One common reason development teams neglect to monitor their web server is because they have trouble connecting the server logs to the application logs. Most web server logs contain limited information—perhaps a time of request, originating IP, payload data, and a response code. That’s not a lot of useful info! Maybe, with well-prepared teams, you might also have information about the browser used to send the request.
For many development teams, that’s not information worth worrying about. They’re far more concerned with application logs—the logs of the code that process the users’ requests and take action on them. As a developer myself, I understand this impulse. I’m regularly tempted to skip over the details from the web server log entries. I want to try to ferret out some bug deeper in the code. But many times, I’ve discovered the source of my bug was right there in plain sight. Maybe the client made a malformed request. Or maybe the user is using a browser we don’t support.
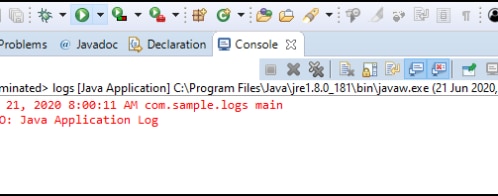
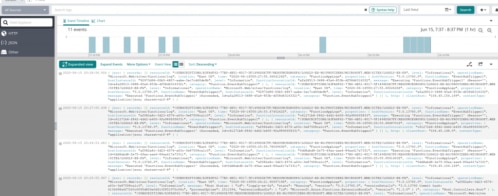
Discovering an error on the server comes from somewhere else is no easy feat. You need to be able to correlate the logs from a web server like NGINX to the logs from an application server. Thankfully, it’s easy to do this with a tool like SolarWinds® Loggly®. When you connect your web server and application logs with a log aggregator, you can see all your logs in succession. You’ll see the web server logs from the start point of a request, followed by the application logs as the server processes the request. Finally, you’ll see the web server’s response logs. Working through these logs is like following a thread. You can trace everything from beginning to end in one convenient place.
When you have a single thread to follow, it’s easy to use your web server logs. NGINX gives you all the information it has, and your log aggregator ties that to each step of the application logs. The logs tell a coherent narrative, making it easy to identify which bugs are coming from outside your server. A 500 response due to invalid request parameters isn’t difficult to troubleshoot. You have the information in front of you.
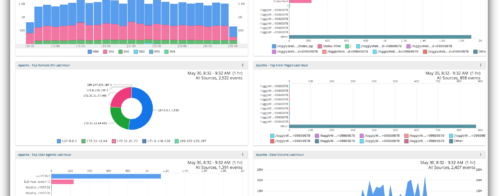
This is one of the great powers of log aggregators. You can correlate all the information about a single request and understand what happened at a glance.
Once you start leveraging your application and web server logs, your challenges start to look different. The problem isn’t that you can’t find the information you’re looking for. Instead, you find much too much of it. One meaningful logging thread is a lifeline. It’s an impossible task to sift through a hundred thousand log entries. Trying to find a needle in a haystack is a cliche, but it’s also what you’d feel like you were doing.
This is where the next powerful capability of NGINX monitoring tools like Loggly comes in. The platform has the built-in capability to look for significant events and to notify your team when they happen. For instance, my team has defined alerts for things like the production web server running low on memory, a database connection dropping, and a third-party vendor’s server returning errors to our requests. When we reach a critical threshold for events, Loggly generates a Slack alert. Our logs are there for when we need them to troubleshoot a significant issue. But when we know an issue is likely to recur, we can set up an alert to tell us about the problem before it’s severe enough to impact our customers.
Even if you’ve set up alerts, you can’t always rely on them. Unfortunately, users are always coming up with new ways to break our applications. That’s where a solid search functionality comes in. When you wind up with a never-before-seen error on your web application, searching through your logs makes troubleshooting much easier. Solid log aggregation platforms make it easy to search based on features about a request. That lets you narrow down the information you’re filtering to determine the root cause of an error. Oftentimes, when the customer reports an issue to you, it isn’t the first or last time your server has generated it. By searching based on traits from the log messages, you can find other instances of the error cropping up. This makes it easy to find the shared attributes of the requests creating the issue.
As a bonus, Loggly makes it easy to take a search and turn it into an alert. It just takes the click of a button to take a search you’re already running and define some parameters. Here’s a screenshot of what the alert setup looks like.
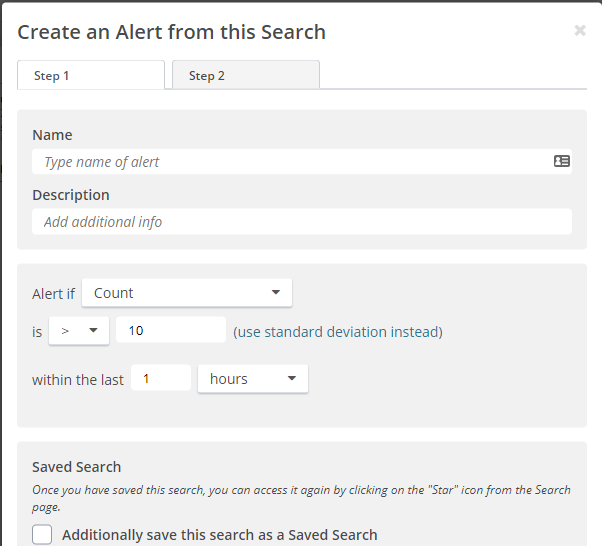
Then, from there, you need to tell Loggly where to send the alert when it detects a problem.
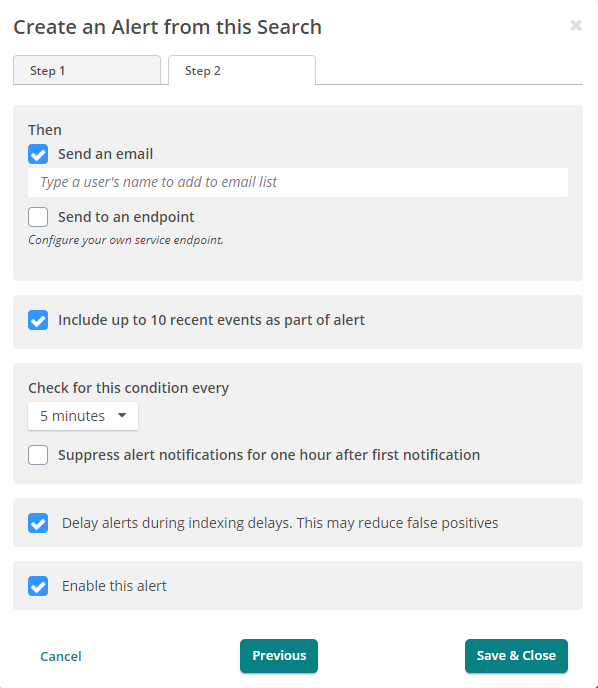
That’s it. The alert exists, and it’s monitoring your web server to make sure you know something’s wrong before your users do.
All of these features build into a cycle. You send your logs to a log aggregator. You use those logs to find one crucial piece of information, then expand the information to other connected pieces. Then, you leverage this information to create an alert, so your logs can tell you something is breaking before it turns into an outage. This cycle repeats, and your team can more effectively leverage the tool, so they spend less time looking at logs. Even better, over time, your team becomes more likely to add logging to code to make it easy to leverage the aggregator. They add simple identifiers to make it easy to correlate related statements. The code contains markers to make it easy to trace errors back to their source. By effectively using the tools at hand, they make their own jobs easier.
NGINX is the beating heart of your web application. Use an NGINX monitoring tool like SolarWinds Loggly to keep an eye on how healthy your heart is and to make sure it’s in good shape every day.
This post was written by Eric Boersma. Eric is a software developer and development manager who’s done everything from IT security in pharmaceuticals to writing intelligence software for the US government to building international development teams for non-profits. He loves to talk about the things he’s learned along the way, and he enjoys listening to and learning from others as well.
Want something different? Try the SolarWinds Log Aggregation Tool