How to track the end user experience with logs
How well do you know your user experience? End users play an increasingly important role in tracking application performance. As technology becomes faster, users become less patient: nearly half of online shoppers say that waiting for pages to load is their least favorite part of mobile shopping, and more than half will abandon pages that haven’t loaded after three seconds.
That being said, user experience is hard to measure. How do you put a number to an experience, and what exactly does that represent? Using logs, not only can you measure the end user experience, but you can use that number to improve the quality of your application and the satisfaction of your users.
Measuring the end user experience
End user experience monitoring is part of a larger strategy called application performance monitoring (APM). APM strives to improve performance and reliability through continuous monitoring, error reporting, and process automation. More specifically, it answers three questions:
- How is my application being used?
- How do the application’s components relate to and interact with each other?
- Which components are causing poor user experiences?
The answers lie in metrics such as resource usage, availability, and error rates. In APM, the end user experience is measured by the time it takes for the application to respond to the user’s input (or “click to glass”). While logging and monitoring response times isn’t difficult, extracting meaningful information requires a bit more effort. Fortunately, there’s a tool that will help us understand exactly how response time impacts the end user experience.
The Apdex standard
The tool we’ll use to measure the user experience is the Apdex standard. The idea behind Apdex is simple: Take the number of users satisfied with their response time, add half of the users who tolerated their response time, then divide by the total number of users. The result is a score between 0 and 1, with 0 indicating no satisfaction and 1 indicating complete satisfaction.

To determine whether a user is satisfied or tolerating, we first have to choose an ideal response time T. Users are satisfied if they receive a response in T or less. Users are tolerating if their response time is between T and 4 * T. Users waiting longer than 4 * T are frustrated. The table below explains this using a T of two seconds.
| Level | Threshold (T = 2 seconds) |
| Satisfied | 2 seconds or less |
| Tolerating | Between 2 and 8 seconds |
| Frustrated | Greater than 8 seconds |
For example, a user who receives a response in 1.5 seconds is satisfied, while a user who receives a response in three seconds is tolerating.
Choosing a threshold
T represents your target response time. That is, if a user performs an action, they should receive a response in an amount of time smaller than (or equal to) T. When choosing a value for T, consider how long your users will realistically wait before abandoning their action. One second is long enough to notice delays, eight seconds might interrupt their thought flow, and 10 seconds risks losing them completely.
Also keep in mind that T is multiplied by four to calculate the tolerance time. You can choose a four-second threshold, but that implies your users will tolerate a 16-second wait. If you are already logging response times, consider using your current average response time as a baseline.
Now that you have your threshold, calculating the Apdex is as simple as taking a sample of response times and plugging it into the formula.
Example: Measuring user satisfaction for a website
Let’s calculate the Apdex for a hypothetical website. Our website consists of an Apache web server proxying requests to various backend services. We’ll add user response times to our Apache logs, then use those logs to calculate an Apdex score.
First, we need to log the time it takes to respond to each user request. Apache can log response times using the mod_log_config module and %{ms}T format string. We’ll also choose a threshold of two seconds (2000 milliseconds), which implies a realistic tolerance threshold of eight seconds (8000 milliseconds).
Next, we’ll use our logs to calculate an Apdex score. We start by counting the number of events where the response time is less than 2000 to get the satisfied count. We then add half of the number of events where the response time is between 2000 and 8000 (4 * 2000) milliseconds to get the tolerating count. Finally, we divide the previous total by the total number of events. The result represents the end user satisfaction based on our target time of two seconds.

There are two things to note about this score. First, this calculates satisfaction based on individual requests rather than users. This results in an overall satisfaction score, rather than a satisfaction score specific to one user. However, we could track the satisfaction of a single user by filtering our source logs by user agent, IP address, or other identifying field.
Second, this score is specific to the timeframe of our source logs. We can calculate daily, weekly, monthly, or even yearly averages by filtering our source logs by date. We can also see how our score changes when we lower or raise the threshold—for instance, to see how close we are to reaching a lower response time.
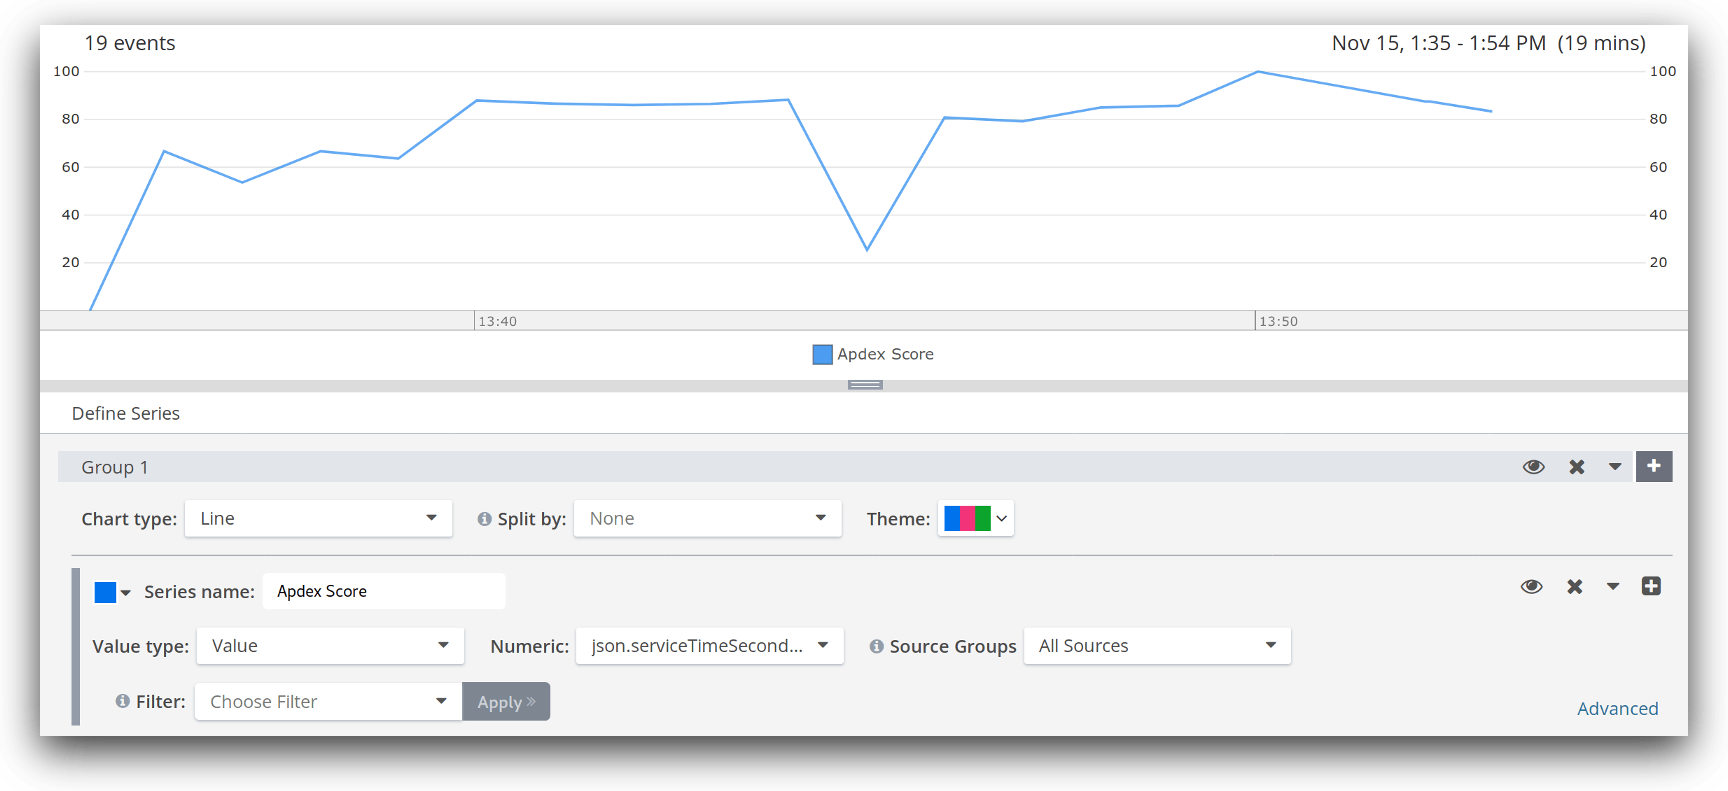
An earlier post explains how to automatically calculate Apdex scores using logs stored in Loggly. The tool used in this post also sends your Apdex score back to Loggly, allowing you to:
- Track your Apdex score over time
- Set alerts for low scores
- Identify trends in your score
- Filter events by date to determine the root cause of a low score
Anticipating problems
APM and Apdex scores can only give you a historical view of the end user experience. To anticipate future changes, you will need to use IT Operations Analytics (or ITOA).
ITOA is an automated process that scans your environment for trends in performance and reliability. It aggregates data from a variety of sources (including logs and APM metrics) and uses machine learning algorithms to extract meaningful information. There’s much more to ITOA than this post covers, such as root cause analysis, determining the impact of service outages, and creating real-time models of application behavior.
Continuing from our previous example, imagine we want to anticipate slow response times as this could affect sales. We’ll monitor our recent Apdex scores for values that go below a certain threshold. Using simple linear regression, we can plot the last few hours of scores and see a trend:
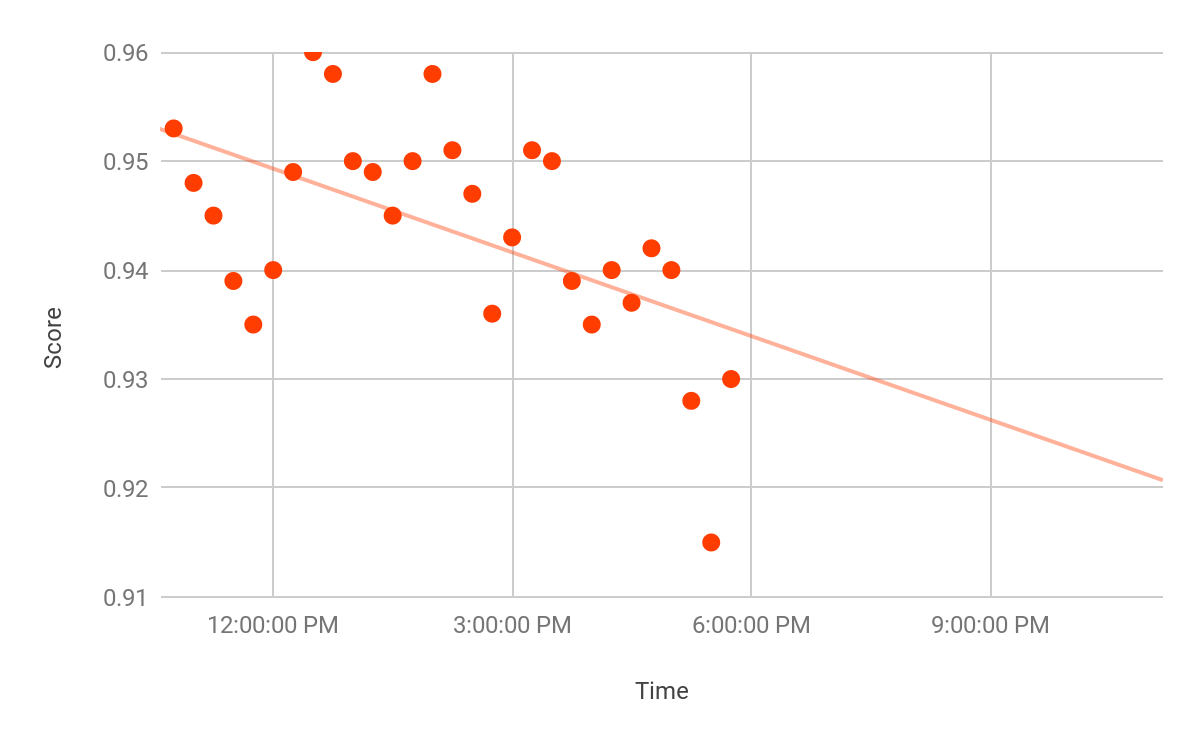
Here we can see a downward trend with a possible dip below 0.9 the next day. We can also see an unusual drop-off around 5 PM. Using Loggly, we can set up an alert to notify us if a number of consecutive scores falls below a certain threshold (e.g. 0.94). Our alert would look like this:
Trigger an alert if the count of logs where ApdexScore is less than 0.94 exceeds 3 over 1 hour.
That is, trigger an alert if we get more than three scores that fall below 0.94 over the course of an hour. This filters out small dips like those around 11:00 AM and 3:00 PM while still catching the large dip around 5:00 PM. Using a more sophisticated condition, we can trigger an alert if the score deviates too far from our normal score:
Trigger an alert if the count of logs where ApdexScore exceeds 2 standard deviations from the mean exceeds 1 over 1 hour.
This triggers an alert if one of our scores falls outside of the normal range of scores. With an average score of 0.94 and a standard deviation of 0.01, the score of 0.915 falls well outside of the normal range and triggers an alert.
Conclusion
While this post focused only on tracking the user experience, you can use this information to identify and troubleshoot performance issues. For instance, a sudden change to your Apdex score could indicate errors with one or more of your backend services. Based on when the score was calculated, you can then narrow down the log events by date to find the underlying cause. You can also use a real-time monitoring solution such as New Relic to correlate performance issues with specific log events.
To learn more about calculating your Apdex score, see Alternative Metrics for Latency Performance Monitoring and its follow-up post How to Implement Apdex Latency Measurement and Monitoring Using Loggly.
The Loggly and SolarWinds trademarks, service marks, and logos are the exclusive property of SolarWinds Worldwide, LLC or its affiliates. All other trademarks are the property of their respective owners.

Andre Newman