AppOptics and Loggly – Better Together
Metrics and Traces and Logs, Oh My!
In this article, we’ll share how you can leverage recently announced capabilities that further integrate SolarWinds® AppOptics™ and SolarWinds Loggly®. Together, they make it even easier to troubleshoot and identify the root cause of application performance problems. Bringing application and infrastructure performance metrics and traces together with logs accelerates the process for pinpointing performance issues, making the combination of AppOptics and Loggly more powerful than simply the sum of both.
Free Loggly Trial Free AppOptics Trial
It’s All About Troubleshooting Performance Problems Faster
If you care about application performance, you’re going to love what we’ve done. Many of you who are Loggly or AppOptics users have asked us to integrate them so you can take advantage of their combined value. No matter your starting point, we’ll show you how you can take advantage of the dynamic union of these two products. Whether you’re currently using AppOptics and want to drill into the relevant logs, or using Loggly and want to dive into related metrics, traces, and application performance monitoring (APM), we’ve got your back. When application performance is poor, it’s critical to look at more than just the performance of the application code; you must also understand the performance constraints of the associated infrastructure the application depends on. And, it’s critical to know about any and all errors thrown by the application. That’s where logs in the context of application metrics and traces come to bear.
Logs contain an incredible amount of detail about transactions, errors, and abnormalities, and even provide high-level statistics such as HTTP error rates for applications. Comprehensive full-stack monitoring requires having ALL the pertinent information available, which means event logs combined with infrastructure metrics, application metrics, and traces. Bringing this information together in a related way across both products enhances the proactive observability of key applications and their performance. Recently released integrations make it easy to bring logs in the context of APM through traces. It also makes it easy to get a metric and trace perspective for those primarily using logging tools to troubleshoot and improve application performance. If your goal is quickly pinpointing what and why there’s a performance problem, AppOptics and Loggly are better together.
Application Performance Management With a Side of Log Management
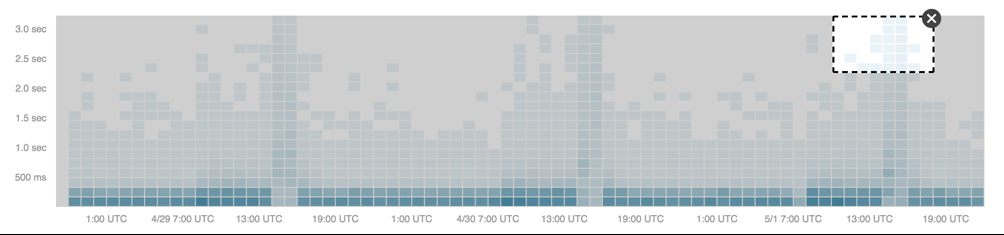
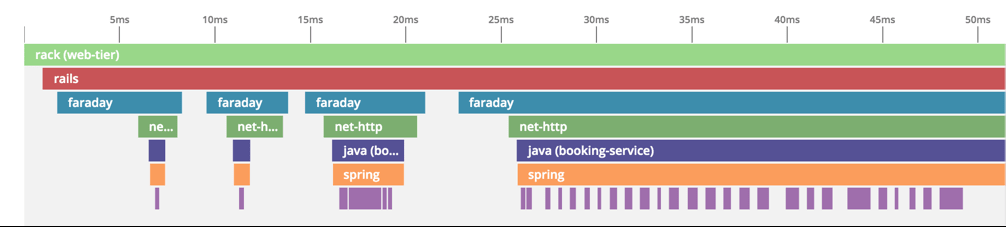
APM encompasses application metrics, metrics for the application’s underlying infrastructure, and distributed transaction tracing. APM provides visibility into bottlenecks across systems, down to a specific function or line of code. View exceptions in a transaction context, and gain a better understanding of the scope. Quickly identify outliers and problem transactions using a heatmap, then drill into the transaction outliers to further troubleshoot application performance issues.
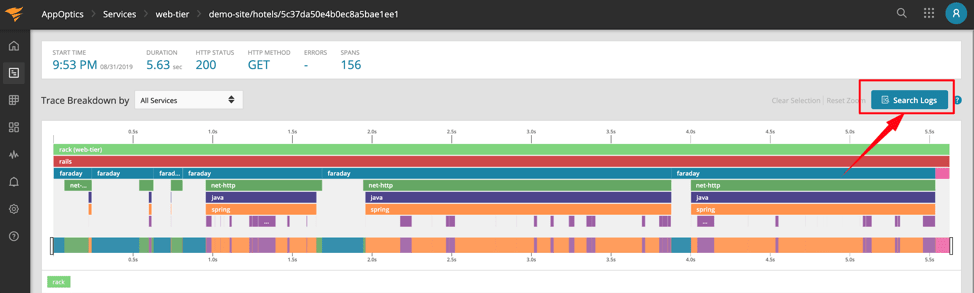
Adding a side of relevant logs, no coding is required! Now that you’ve identified the poor performing transaction trace, a logical step would be to look at all the logs associated with the services making up that transaction to see if abnormalities or errors are causing the problem. To see all the logs associated with a specific transaction trace, find the “Search Logs” button on the trace and click it—that’s it. See how easy it is. Regardless of how many services make up a transaction, the loglines produced from any of those services will have the same embedded traceID and will be displayed in the Loggly event viewer.
Log Management With a Side of APM
Logs can make it easy to identify errors and abnormalities in applications and their environment. Knowing there’s an error impacting the performance or availability of an application isn’t the same as knowing why the error occurred. By integrating Loggly with AppOptics, you also have the option t enrich the value of your existing application logs. What does this mean? When using the AppOptics APM libraries, a unique ID that identifies a user request can automatically be appended to your loglines. These IDs enable you to view precisely which log messages came before (or after) an error message. See the logging with context post for more information.
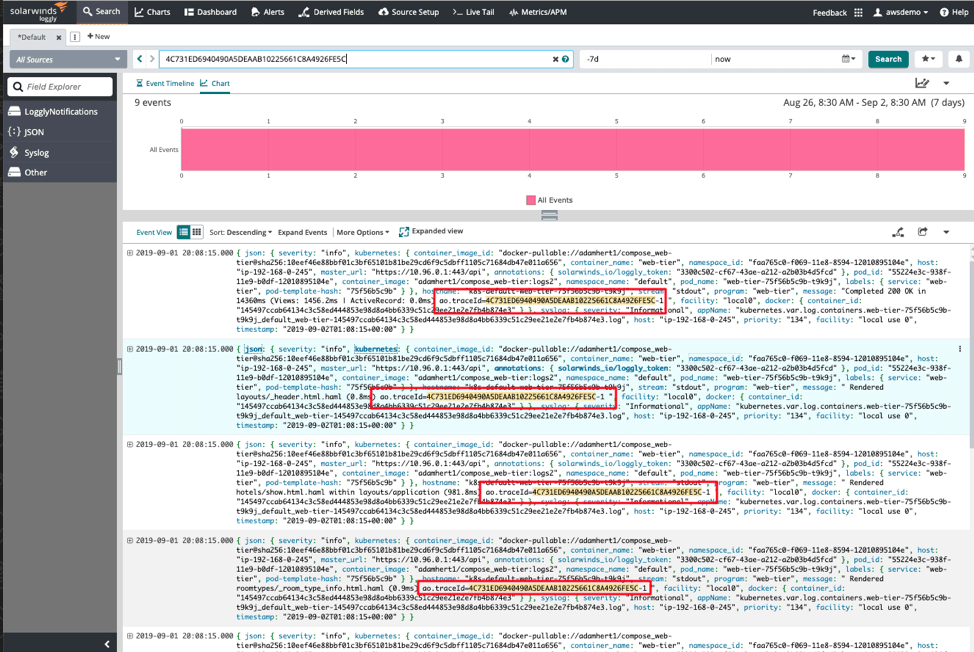
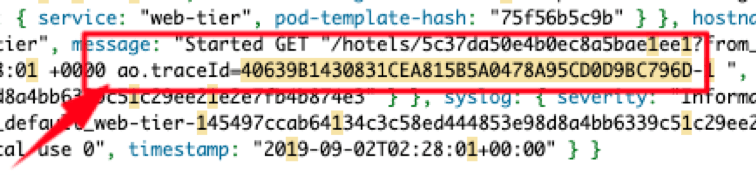
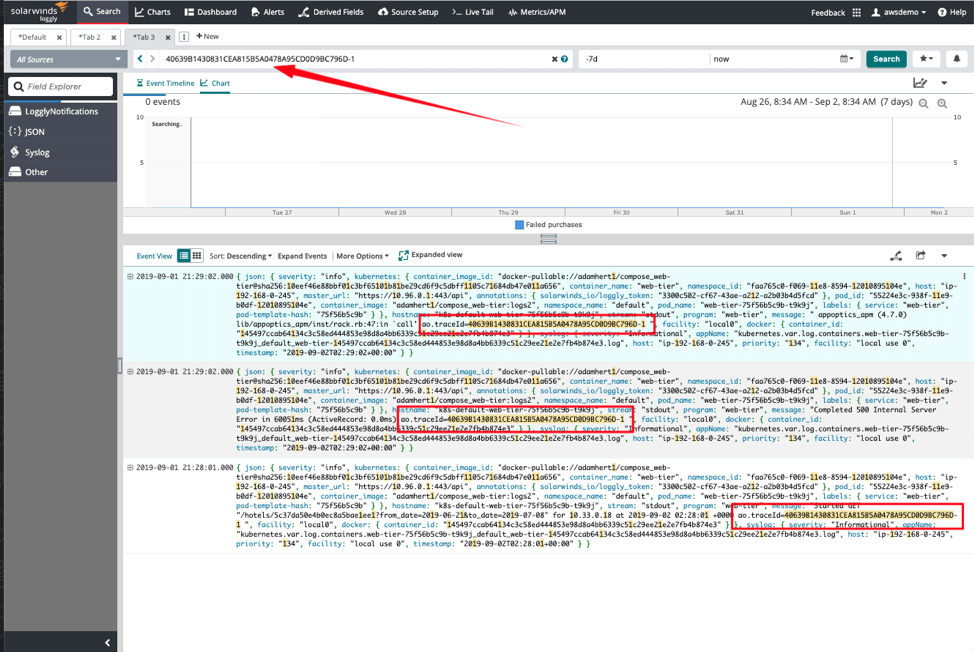
You are searching through events in Loggly, and there is logline calling showing an error, but it doesn’t tell you why. It may take some time to find the logline that can tell you why the error occurred. With AppOptics installed, that logline could also have an embedded traceID, which makes finding the other related loglines simple. Put the traceID from the logline that had the error into a Loggly search. It’ll provide all the relevant loglines associated with a transaction, thus making it easier to identify the logline that holds the answer to why there was an application error. The embedded traceIDs can help you with troubleshooting in Loggly.
SolarWinds Snap Agent – A Single Shared Agent
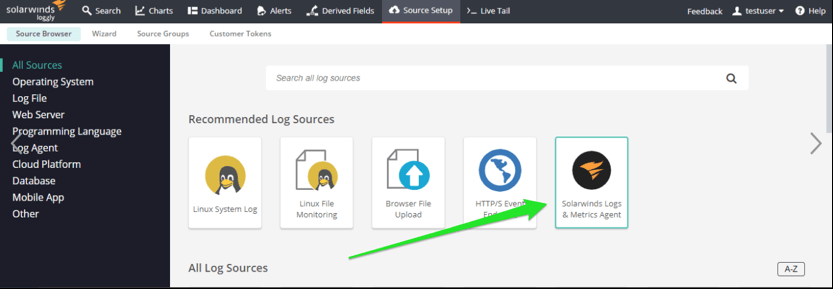
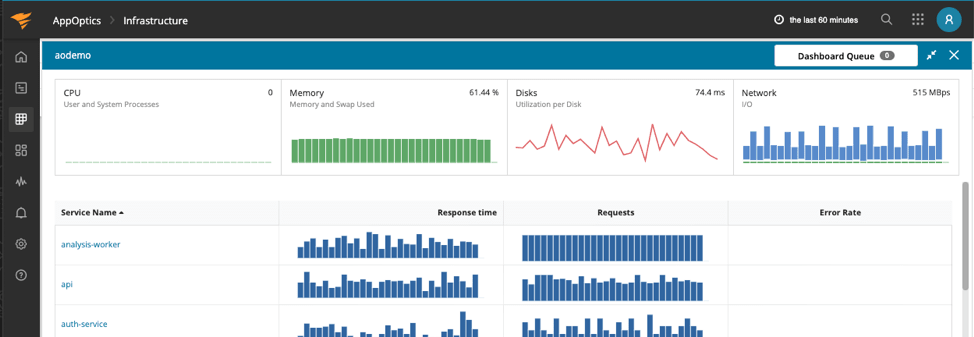
The SolarWinds Snap Agent is a new way to collect logs from a system, and offers capabilities such as auto-detecting logs and log filtering. Log filtering lets you determine what logs are important enough to send to Loggly, allowing you to leave the rest behind and saving you money—you won’t be charged for data you don’t need. In addition to collecting logs, the SolarWinds Snap Agent monitors the health of the hosts collecting metrics such as CPU, memory, disk utilization, and even has plugins for things like databases, web servers, Docker, and Kubernetes.
I’ll Have Some Metrics With That APM
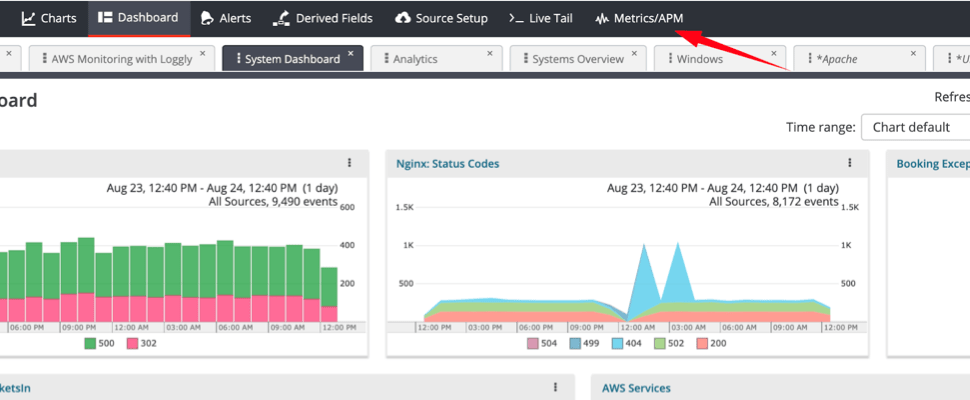
By installing the new SolarWinds Snap Agent, Loggly users have a new way to collect log data. At the same time, this shared agent will also be collecting metrics data. By simply clicking into the infrastructure and application metrics from Loggly, you can also minimize the time it’ll take to figure out what needs to be done to fix an issue. To access these metrics in AppOptics, simply click on the new “Metrics/APM” navigation in Loggly, and you can quickly move between logs and system and application metrics.

If keeping your applications up and running and performing as designed is part of your job description, then having the right set of integrated tools to succeed is essential. We understand that at SolarWinds, and continue to evolve our APM suite to make it even easier and faster to troubleshoot and remediate performance problems.
The best way to learn more about monitoring metrics, traces, and logs together is to try it. Setup is quick and easy whether you’re adding log monitoring with Loggly or adding application performance monitoring with AppOptics, or both.
Free Loggly Trial Free AppOptics Trial
The SolarWinds APM suite provides a solution that can improve observability across the stack. The suite includes AppOptics, Loggly, and web performance monitoring with SolarWinds Pingdom®. In this article, we discussed how to accelerate troubleshooting on the server-side whether you have pinpointed the ‘application’s issue from a specific log or a poor performing line of code. To complete the full picture of observability, you also might want to take an outside-in perspective—an end-user perspective of how your web application is performing. With Pingdom, you can add the user perspective along with metrics, traces, and logs.
The Loggly and SolarWinds trademarks, service marks, and logos are the exclusive property of SolarWinds Worldwide, LLC or its affiliates. All other trademarks are the property of their respective owners.

Loggly Team