Technical Resources
Educational Resources
APM Integrated Experience
Connect with Us
Apache has been a friend of the web for about two decades now. Back when its adoption started, setting up Apache was a task for SysAdmins. But now, almost anybody can set up a quick LAMP stack and be on their way. Listing all of Apache’s modules and what each of them do would take more time than we have today. As cool as it would be to talk about SSL, TLS, proxies, databases, and what have you, we’re here to talk logging. When it comes to log events, Apache is incredibly solid.
In this post, I’m going to make sure you have everything you need to know about Apache logs. There’s a lot of information out there, and you might have to do some web surfing and scouting to try to find the right information and what works or doesn’t. Some sites might discuss the access log, others the error log, but as you may know, Apache’s capabilities don’t stop there. Before we even start, I’ll suggest a tool to help you manage this information and properly understand the information in your logs.
Apache is a solid option for logging thanks to its ability to track events happening to the server. The access log, in particular, is in charge of tracking hits to the pages served by the web server. It includes a time-stamped event (basically all events processed by the web server) with the IP address of the remote host, also called a client. The access log also includes the HTTP method requested and the response code sent by the server. Overall, the access log is the one-stop solution when you want to know who’s accessing your web app.
It’s useful for developers to understand and debug how the pages are being served. A sample of a request (not a friendly one, by the way) may look like this:
5.101.0.209 - - [14/Mar/2020:20:40:53 -0500] "GET /?a=fetch&content=%3cphp%3edie(@md5(HelloThinkCMF))%3c/php%3e HTTP/1.1"
500 30296 "http://102.3.1.2f:80/?a=fetch&content=<php>die(@md5(HelloThinkCMF))</php>"
"Mozilla/5.0 (Windows NT 10.0; Win64; x64)
AppleWebKit/537.36 (KHTML, like Gecko) Chrome/78.0.3904.108 Safari/537.36"
As you can see, it doesn’t offer information for developers only. Someone from OpSec might benefit from looking at the information and understanding what to do to protect the application. In this case, it looks like someone from Russia was trying to execute a malicious PHP function. You can see how the PHP function is trying to be inserted in the URL. This is a typical early stage pen-testing request, normally to probe the web server’s security. We can easily see our server responded with an Error 500. You can also see the “browser” used, although this request is probably a curl script masked as a known agent.
By default, Apache will use the common log format, or CLF for short. The logs will be formatted as follows:
LogFormat "%h %l %u %t \"%r\" %>s %b" commonThe %h represents the host (5.101.0.209 in our example above). Tutorials tend to forget to remind readers that the IP address may not be accurate. If there’s a proxy in the middle, then it’ll show the IP of the proxy instead of the actual IP.
Next in line, we have a hyphen (%l), which represents a missing data in the log line. In this case, we’re missing user identification from the request. The rest of the options are a bit more straightforward. %t ([14/Mar/2020:20:40:53 -0500] above) is the timestamp of the request, which you can format to your needs. Then, in double-quotes, is the request (“%r\”) separated by spaces. The string begins with the method used (GET), followed by the resource attempted to reach and ending with the HTTP protocol (HTTP 1.1).
If you prefer to split the request into individual lines, you can do so by defining your own log format. Toward the end of the log line, we find the status code returned by the server (%s) and the size (in bytes) of the returned object.
These are just the common variables. We’re not going to go through the entire list, so we’re barely scratching the surface of how customizable Apache can be.
A website can log many web server events per minute (or second). Depending on the traffic load, the number of logs can make it complicated to keep an eye on them, not to mention processing and parsing all the information manually. Similarly, if you have multiple servers or your app follows a microservices infrastructure the number of logs will grow exponentially.
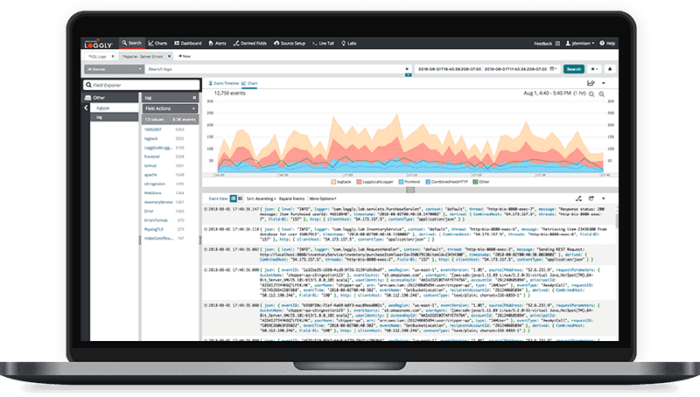
SolarWinds® Loggly® can take care of processing that for you. You can pipe your logs from your servers, and Loggly integrates with Jira, Slack, or whatever alerting system you use on your end. Setting it up is easy, and your team will love having everything centralized in one spot.
Probably a better-known log type in Apache is the error log, where Apache stores both errors and diagnostics information about what’s going on with the web server. As Apache puts it, it’s the number one place to look for answers when a problem occurs.
By default, you can find the error log location in the configuration file (apache2.conf). You can also rename it as needed.
# ErrorLog: The location of the error log file.
# If you do not specify an ErrorLog directive within a
# container, error messages relating to that virtual host will be
# logged here. If you *do* define an error logfile for a
# container, that host's errors will be logged there and not here.
#
ErrorLog ${APACHE_LOG_DIR}/error.log
If you don’t find it there, look for /var/log on *nix systems. If you’re using a virtual host, you can configure an error log dedicated to the host, or the errors will be appended to the main log instead. It’ll depend on your needs.
A sample error request might look like this:
[Sat Mar 14 06:25:01.658235 2020] [mpm_prefork:notice] [pid 25021] AH00171: Graceful restart requested, doing restartAs you probably might guess by now, you can use the access log to mine general information and responses to the visitors, while leveraging the error log to find out what happened.
Once you know where it is, the easiest way to keep an eye on it (on one of them at a time) is to run the following code:
tail -f /var/log/apache-log-file.logIt’ll “follow” the log, and with any luck, the log is small enough (only a few megs) for you to understand what’s going on. Within each log line, you might see different log levels, depending on the issue’s severity. We won’t cover all of them here. But there’s a lot going on and you’ll benefit from proper log management procedures.
Of course, all this information is meaningless if you can’t parse it, let alone process it. For that, you’re going to need a tool to help you understand the insights behind all this data. A good tool should assist you in creating alerts and setting thresholds of actions.
Managing and understanding the logs can be overwhelming. The information you can gather from them is infinite—the insight into your users’ experiences, the readiness to tackle unexpected threats. The possibilities are endless.
Loggly will be there for you along the way. Fourteen days is all you need to love it, and that’s more than enough for Loggly to become a staple in your toolkit. What are you waiting for to take control of your app?
This post was written by Guillermo Salazar. Guillermo is a solutions architect with over 10 years of experience across a number of different industries. While his experience is based mostly in the web environment, he’s recently started to expand his horizons to data science and cybersecurity.
Still searching? You may be interested in the SolarWinds Apache Log Analysis