API Endpoint Analytics Using Loggly
When building an API, tracking endpoint usage can often be a pain. While there are commercial products aimed more towards browser analytics, for example Google Analytics, there aren’t as many well known backend tools. Of course, New Relic is common for server monitoring (I am personally a huge fan). While it can be used as an excellent tool for API endpoint analytics, there may be instances where it feels like a bigger solution than is necessary.
The same can be said for self-hosted open source solutions, such as Piwik, but these types of solutions (as well as other analytics tools that have backend clients available) require you to add an outgoing API call to track data every time an endpoint is hit. If your main concern is tracking overall API endpoint usage, using something at the server level rather than within your application itself won’t interfere with your API speeds.
This is where a solution like Loggly comes in. Since you are already using Loggly for log aggregation (you are utilizing log aggregation right?), you can easily track your API endpoint usage by referencing your web server access logs. Using the Loggly web application, referencing Apache logs as an example, you can see endpoint access counts over a period of time based on requestURI.
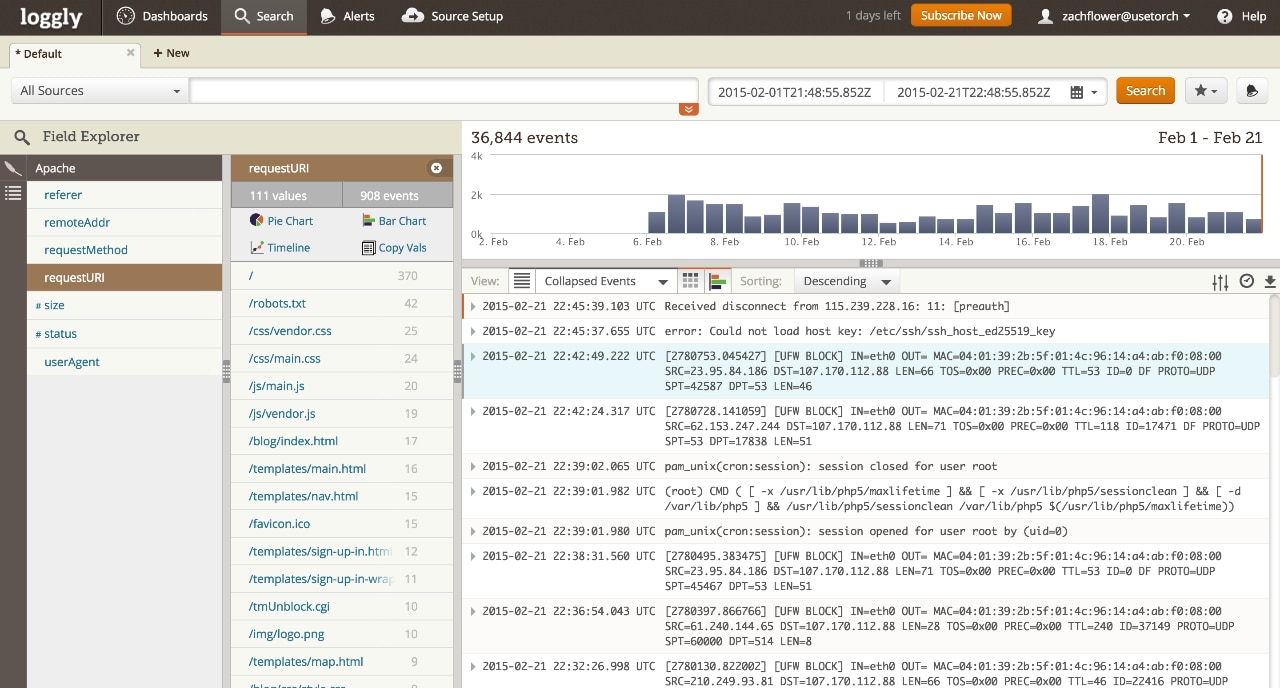
As you can see, this gives you the access counts (over a selected period of time) of the various pages of your web server. Obviously, this information is useful but not entirely actionable. Luckily, Loggly lets you view log values over time, which is an excellent way to track how API endpoints get used over time.
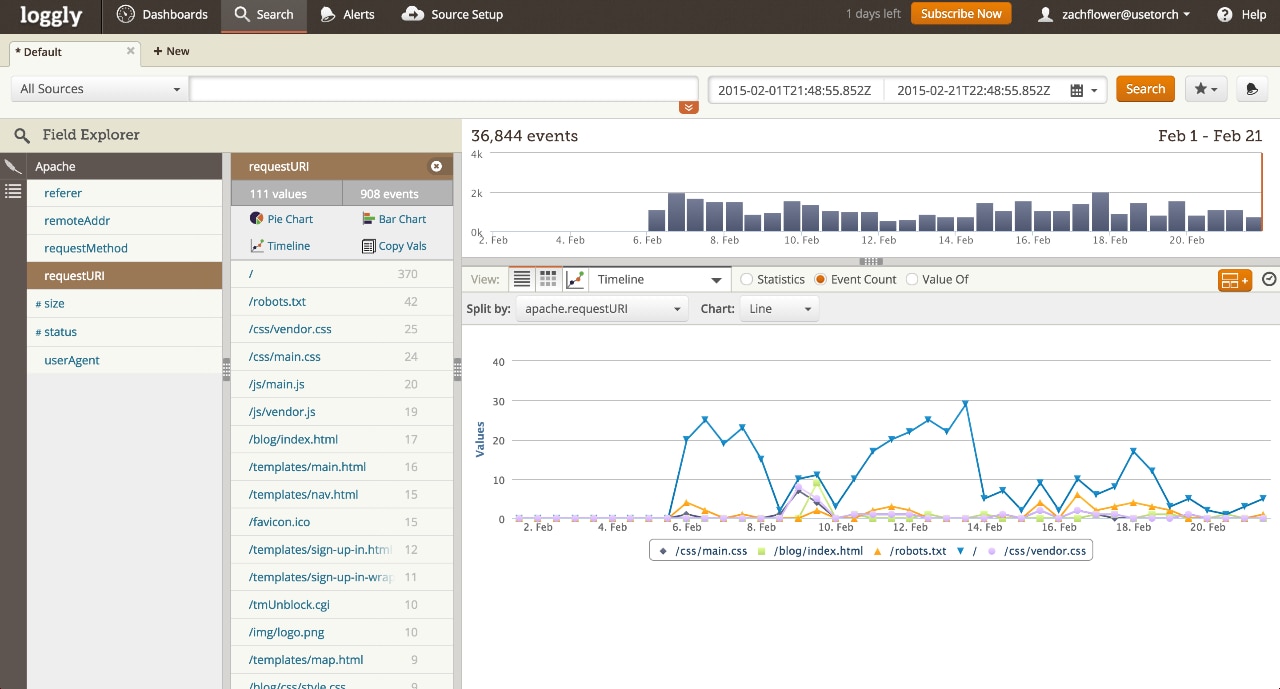
This is just a basic example. You can easily set up a search tab that filters out only API endpoint queries, or you can even set up multiple tabs to compare and contrast different API versions. Don’t be afraid to get creative here, and if the current feature set doesn’t quite fill your needs, definitely head on over to Loggly’s API Overview page for more ways to manage and retrieve your log data.
Get started on getting insights from your data: Try Loggly for free today!
The Loggly and SolarWinds trademarks, service marks, and logos are the exclusive property of SolarWinds Worldwide, LLC or its affiliates. All other trademarks are the property of their respective owners.

Zach Flower