When the Average is a Poor Metric for Measuring Application Performance
Systematically measuring application performance is the best way to make steady improvements that translate into a much better customer experience. If you are measuring and monitoring the performance of distributed applications, you may be inclined to use average values. In this blog post, which is the first in a mini-series, I’ll discuss three reasons why this may not be a great idea, especially when tracking latency.
For identifying performance issues, latency is essential. Paraphrasing performance expert Greg Brendan, latency is time spent waiting, and it has a direct impact on performance when caused by a synchronous process within an application request, thus making interpretation straightforward — the higher the latency, the worse the application performance. This is in contrast to other metrics used in performance analysis — utilization, IOPS (I/O per second) and throughput — which are better suited for capacity planning and understanding the nature of workloads.
Here are three reasons why average values are not always the best way to understand latency for an internet application:
- You may have outliers, which will distort your average values.
- Even if you do not have outliers, you may be averaging different populations.
- Even if you have a single population, that population may have a skewed distribution (which in fact is normally the case for Internet applications).
1. Outliers will distort average performance values, but throw them out at your peril.
Outliers in latency data can result from multiple causes, from a very unusual event to poor logging practices. For example, a user’s poorly crafted query can generate a very high response time that shows up in your logs. Poor application logging practices can also introduce outliers. In one case, when a query took longer than a certain threshold, the developer simply printed the timestamp out to the log, instead of the actual response time, generating response times on the order of years!
Care must be taken, however, when hardcoding thresholds separating “valid” data from outliers because you run the risk of discarding valuable data with the bad. To avoid this, I try to remind myself how NASA missed the discovery of the ozone hole above Antarctica. Their scientists had programmed their software to discard satellite data showing values below 180 dobson units for ozone concentration, flagging these readings as instrument errors (Green, P. and Gabor, G, “Misleading Indicators: How to Reliably Measure your Business, p. 77).
2. You don’t want to average different populations.
Even if you do not have outliers, you could be mixing data from different populations. If the underlying differences are large enough, the average will not be representative of the entire population. For instance, you may have a reasonable average for your application response time. But if the 10% slowest times all come from the your most profitable customers, the average is hiding the fact that your business it at risk.
Exploring the distribution of data using visualization and classification in order to find clusters that make sense is key. Here is an example of the height distribution among professional basketball players:
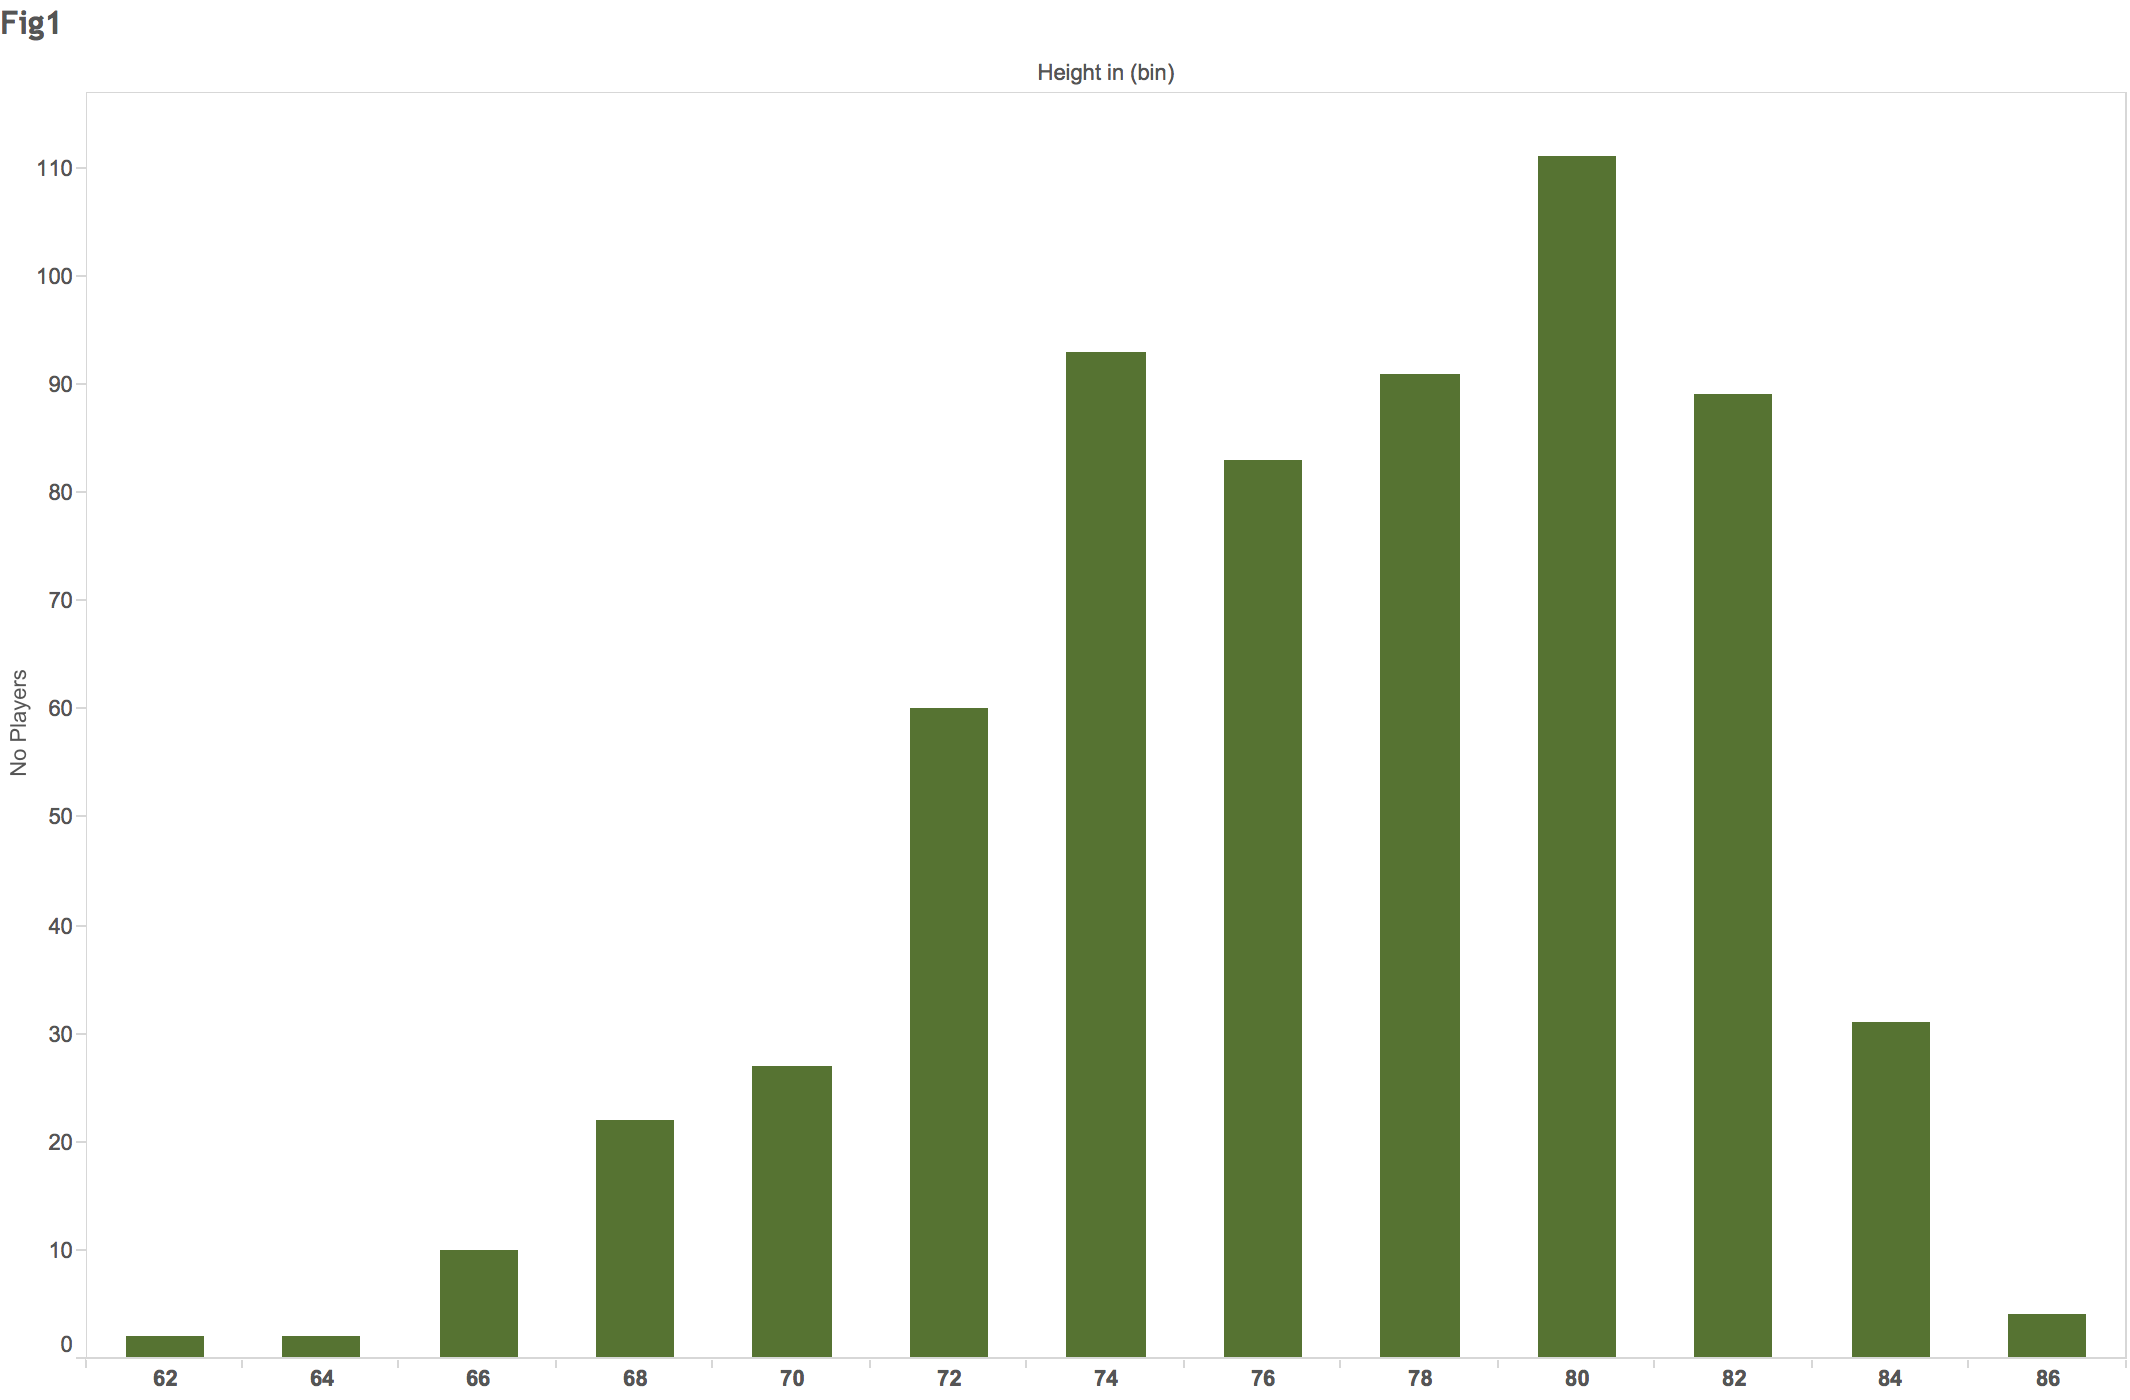 Distribution of professional basketball players by height (NBA and WNBA)
The above histogram masks the fact that the distribution for WNBA and NBA players is quite distinct, so the average for the group is not representative of either population. In fact, the tallest WNBA player would have average height in the NBA league:
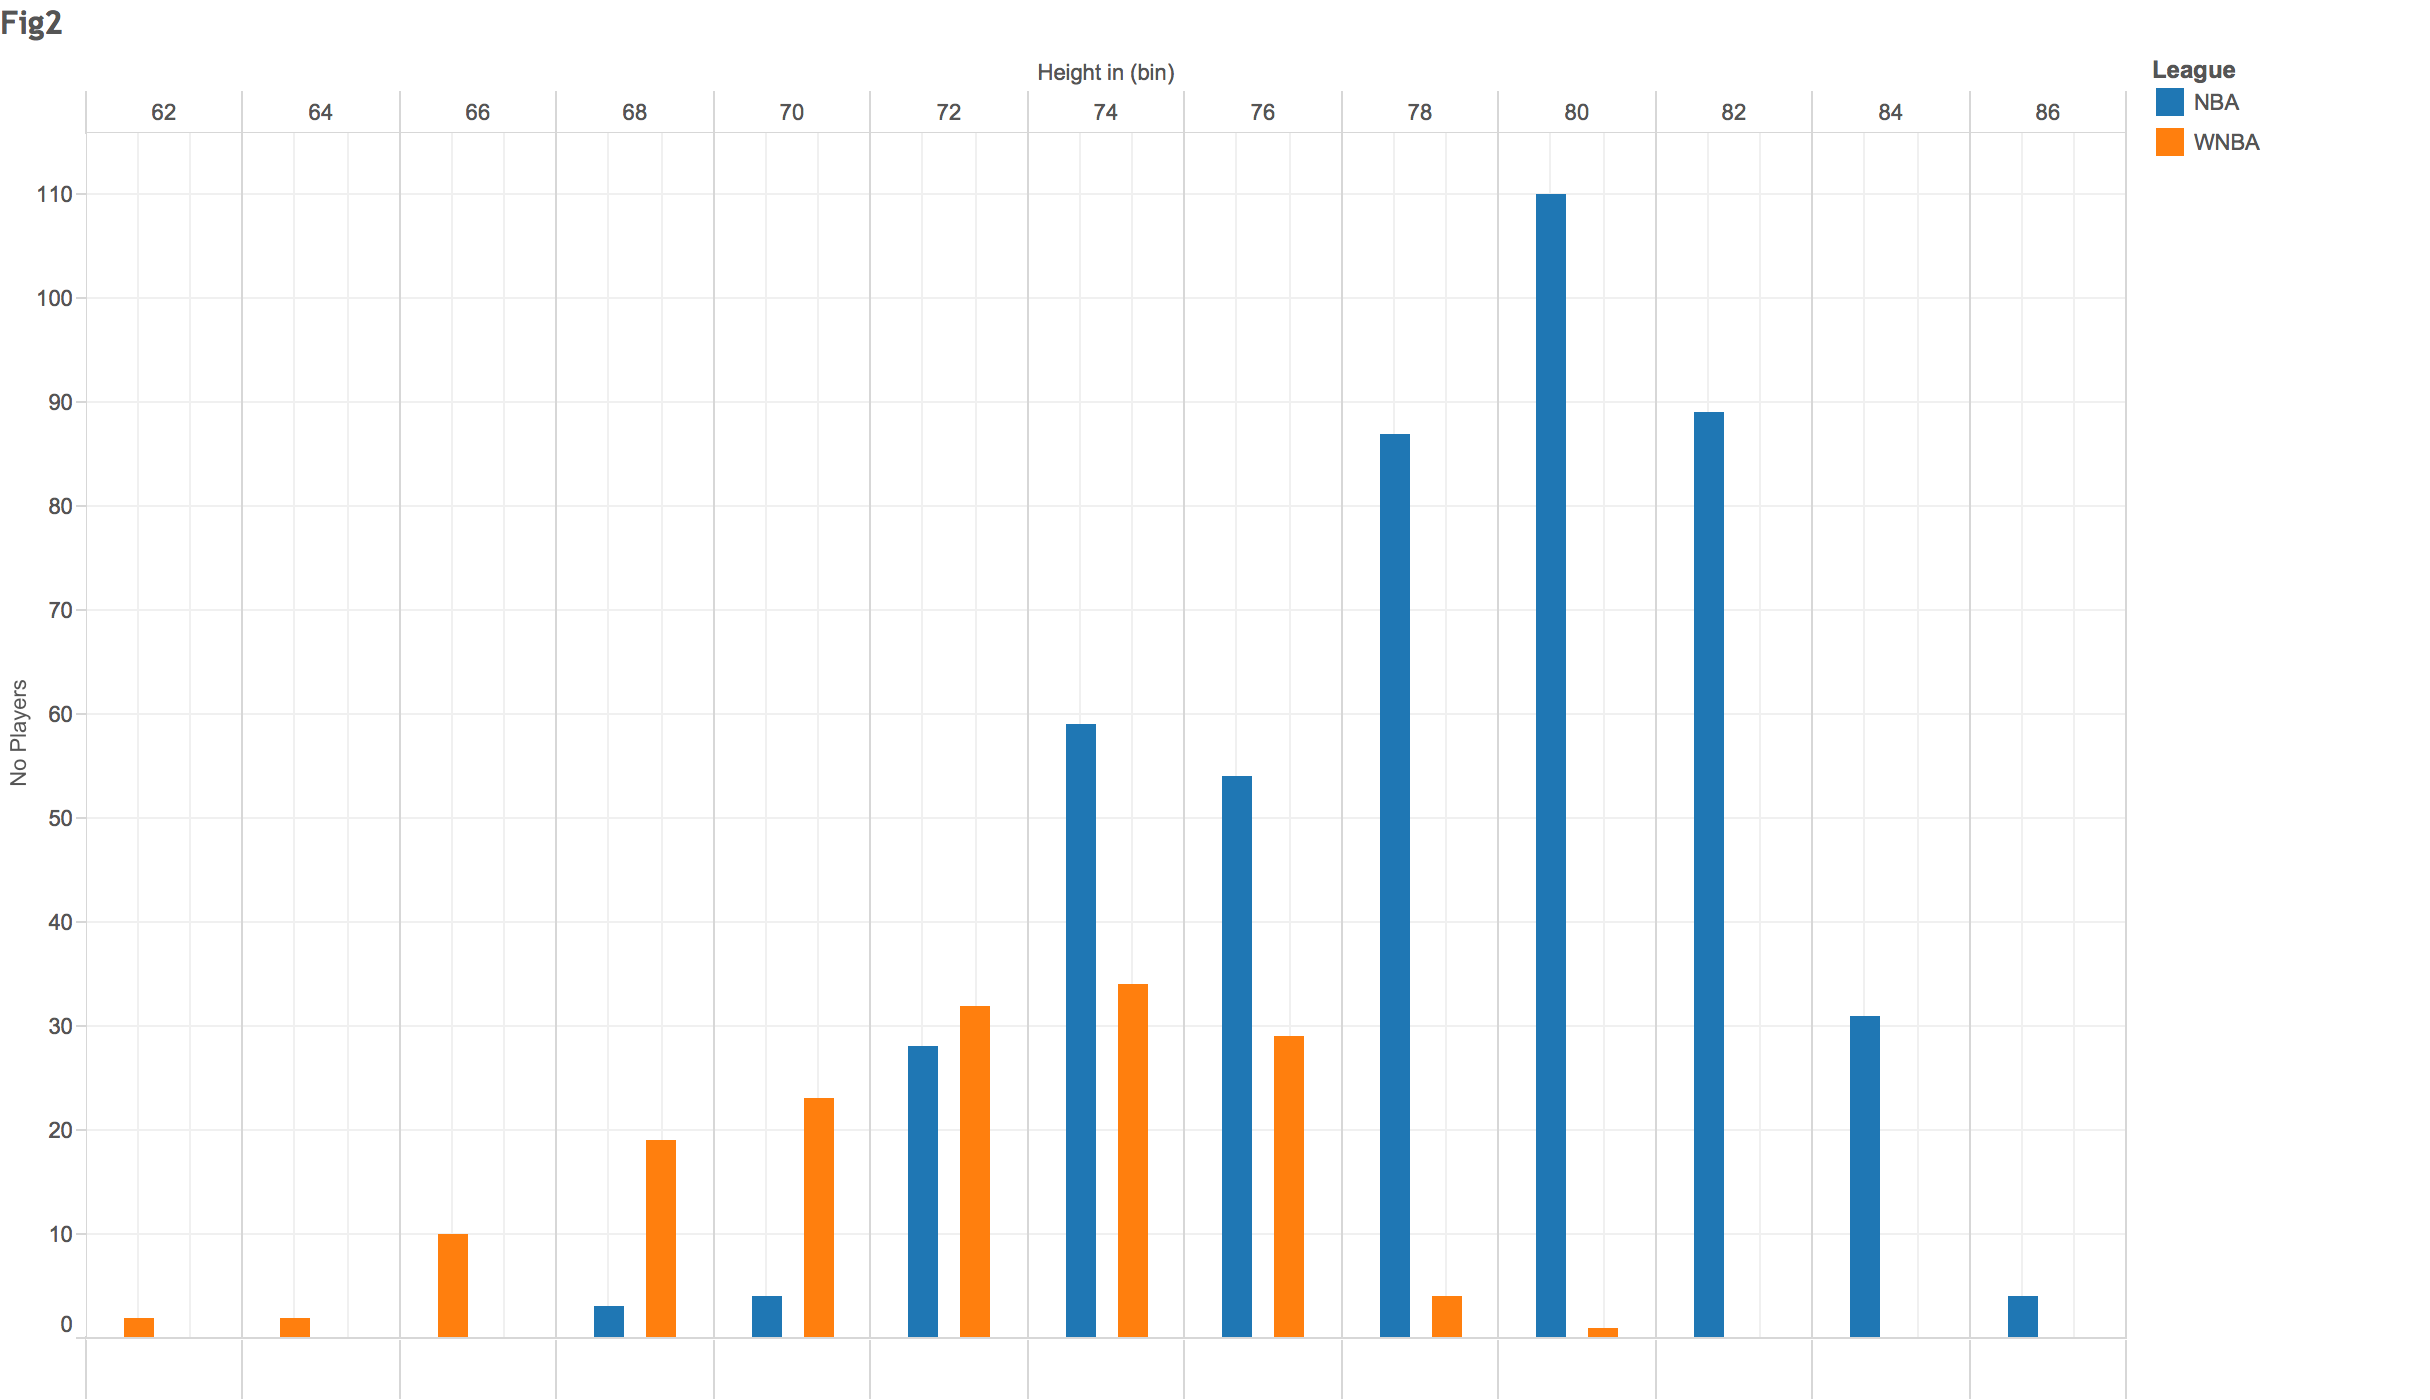 Different populations need to be identified in order to make sense of data distributions
Source: https://wagesofwins.com
In the realm of latency performance, oftentimes responses resulting from cached data will have a very different distribution from those that need to be fetched from disk. The type and characteristics of a query will also impact latency. Click here for an example by Mike Bostock from Github data ().
3. Skewed distributions aren’t well represented by averages.
While the bell curve, or normal distribution, is of fundamental importance to statistics, there are other distributions that are universally applicable in the realm of real things, and also turn out to be highly skewed. These include Benford’s Law, the Pareto Distribution and Zipf’s Law.
Lets focus on Benford’s Law. We naively assume that in any real-world dataset, each first digit from 1 to 9 has the same probability of occurring — at about a 11%. On the contrary, Benford Law states that the distribution of first digits will have 1 as the most common digit and 9 as the least common, in a precise logarithmic relationship.
For example, here is leading digit frequency in Twitter follower counts:
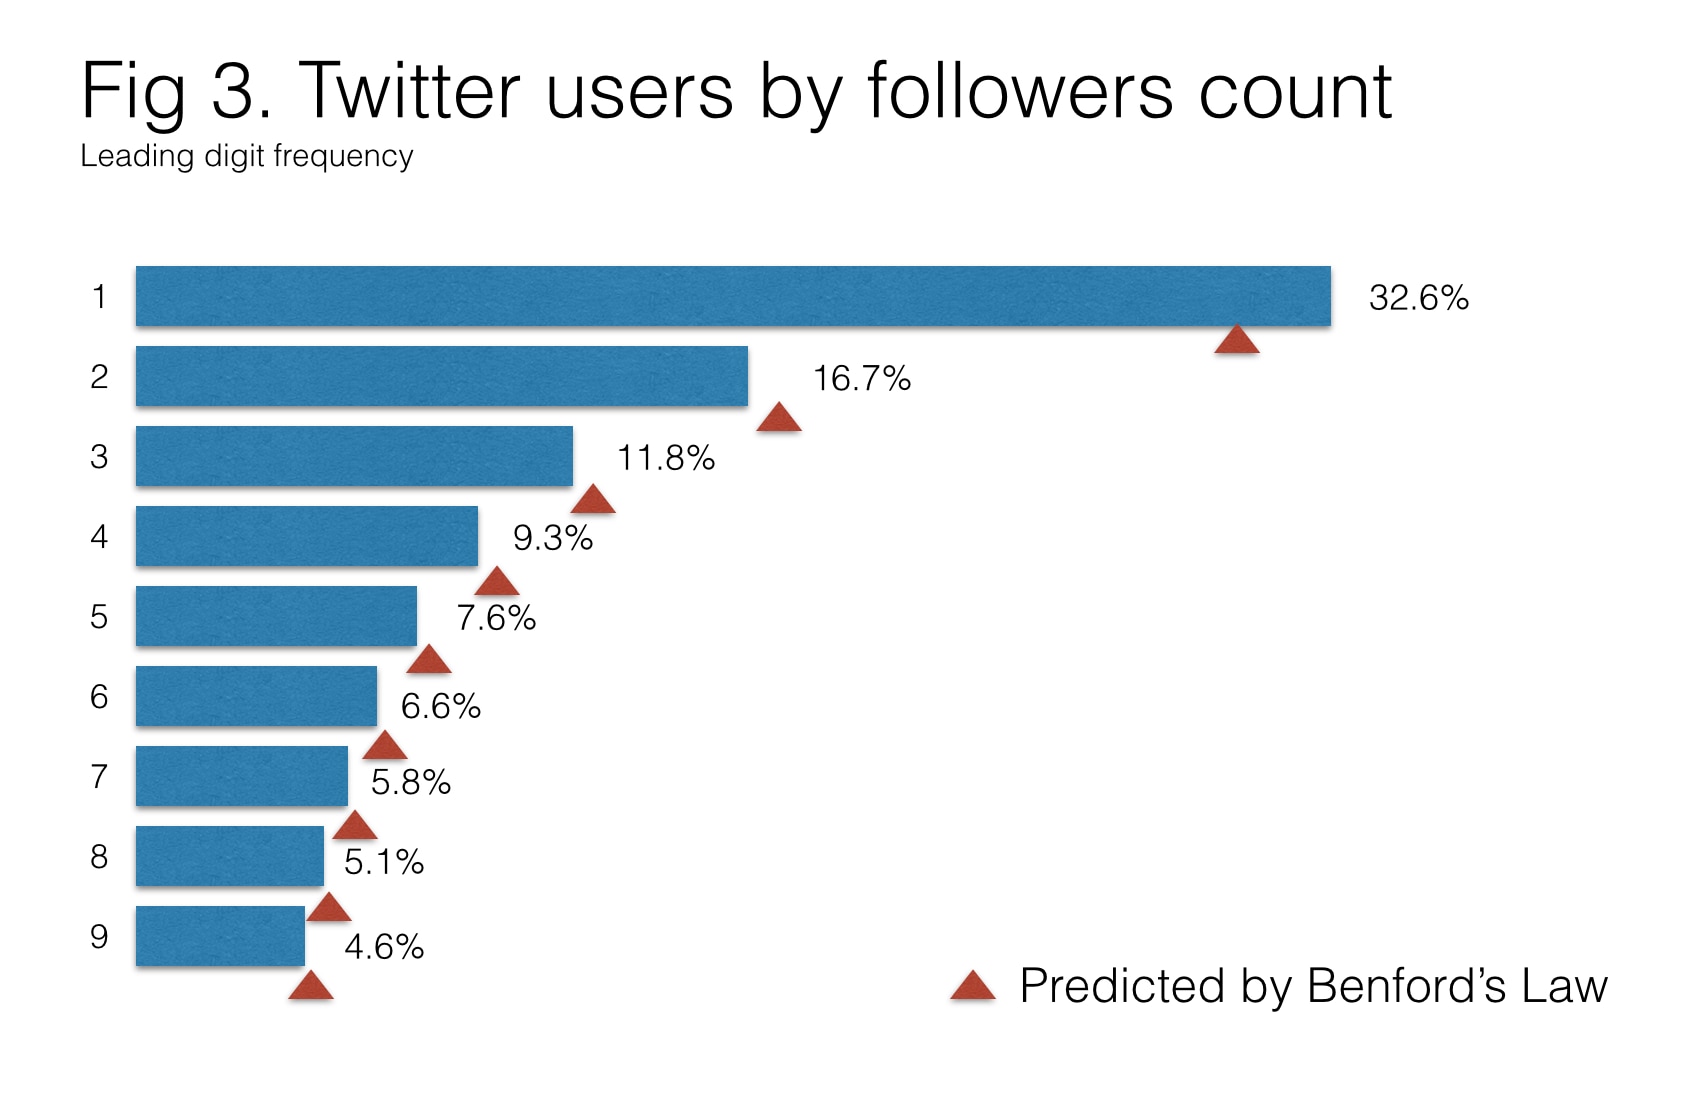 Skewed distributions describe the real world in surprising ways
Source: www.testingbenfordslaw.com
Benford’s law states that “1” occurs 30% of the time as first digit, digit “2” 17.6% of the time, digit “3” 12.4% of the time, and so forth, with the expected proportion of numbers beginning with leading digit n being . Correspondence with Benford’s Law gives us a higher degree of confidence that a dataset represents real phenomena and is not manipulated, rounded or truncated. For the law to hold, the data must also take values as positive numbers, range over many different orders of magnitude, and arise from a combination of largely independent factors.
Benford’s Law is used to detect potential fraud in several instances, such as: elections, tax returns, macroeconomic data, scientific results, etc. In other instances, such as budget planning, it can help detect poor practices, also known as wild guesses.
Long-tailed Distributions are Common in Internet Applications
So having established that skewed distributions are also universal using Benford’s Law as one example, it’s important to note that latency performance metrics for Internet-based applications are usually not normally distributed, but rather have a distribution with a heavy tail.
The exact cause is not well defined, but is related to the fact that there are complex relationships between system components which are not well understood . For example: (i) load distribution among nodes in a distributed application is not always even, and initial variations can have long-range effects; (ii) at the application and hardware level, some data is fetched from memory cache, other directly from disk; (iii) Resource contention causes latency in components, in patterns which are not well understood, for instance, in disk arrays, etc.
Poor latency performance has two important dimensions which need to be addressed. There is the objective fact — the hard numbers — which need to be explored in a high degree of detail in order to find root causes.
Yet performance in customer-facing applications is also subjective — what is acceptable today, may not be tomorrow, and what is acceptable in some contexts or by some customers, is not acceptable by others. In my next blog post I will look at a performance metric to measure latency that takes this subjective factor into account.
Are you interested in how to apply data to your optimization efforts?
I’ll be participating in a VentureBeat webinar on this topic this Thursday, December 11, 2014 at 9:30 a.m. PST. VentureBeat has rounded up a great panel of big data stars to discuss strategies for taking mountains of data and turn it into actionable insights. So register now and don’t miss out!
Further Reading
- Gregg, Brendan. “Visualizing System Latency.” Acmqueue. 28 May 2010.
- “Long-tail Traffic.” Wikipedia.
- Bostock, Mike. “Gist API Latency.” 2 May 2013.
- Tao, Terence. “Benford’s Law, Zipf’s Law, and the Pareto Distribution.” 3 July 2009.
- Xiao, Yunong. “Node.js in Flames.” Techblog.netflix.com. 9 Nov. 2014.
The Loggly and SolarWinds trademarks, service marks, and logos are the exclusive property of SolarWinds Worldwide, LLC or its affiliates. All other trademarks are the property of their respective owners.

Mauricio Roman