Logs for Drupal: Why You Need Them and How to Do It
Your team invested countless hours in development.
Your QA people can barely keep their eyes open because they have worked so hard. Your lead developer who’s responsible for the deployment is almost dehydrated from so much pressure and sweat.
But it’s all worth it. Your app is live. Now everybody goes to sleep, and your pampered app is all alone, serving your data to the entire world.
You forgot one thing: to give it a phone to call home and tell you something went wrong.
You should have logs
Debugging is like being the detective in a crime movie where you are also the murderer.
— Filipe Fortes (@fortes) November 10, 2013
Arguing that logs are important is like arguing that automatic tests are important. Everybody knows that. It’s just that very few actually do it. The biggest barrier is that it’s hard to take the first step. In Drupal, for example, there’s a watchdog that can send your errors to the DB, but it’s unrealistic to expect anyone to dig up an error in real time on multiple live apps. Drupal also provides a Syslog module that can later be used to forward the logs. However, since many sites are hosted on platform solutions such as Pantheon, Syslog isn’t always available.
In order to lower the barrier, Gizra has developed as part of its “The Gizra Way” a general logging module that can send your watchdog data via HTTP called Logs HTTP. You just need to set the URL and the severity level you would like to capture, and you’re done. This module can work with a variety of log management solutions, including the open-source Logstash or the cloud-based Loggly. Here is what the configuration for Logstash looks like:
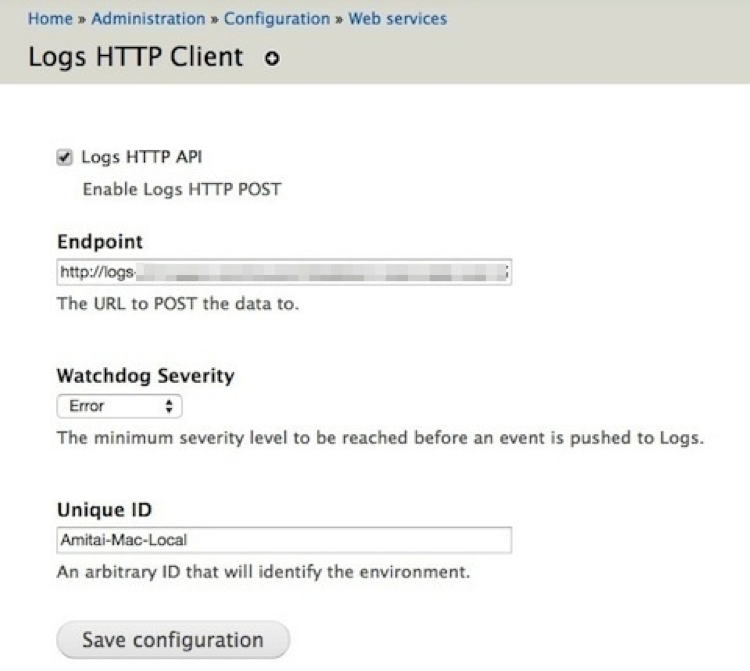 Figure 1: Configuration page. Just add the HTTP endpoint.
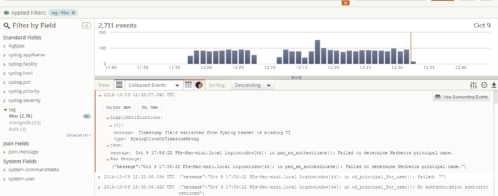
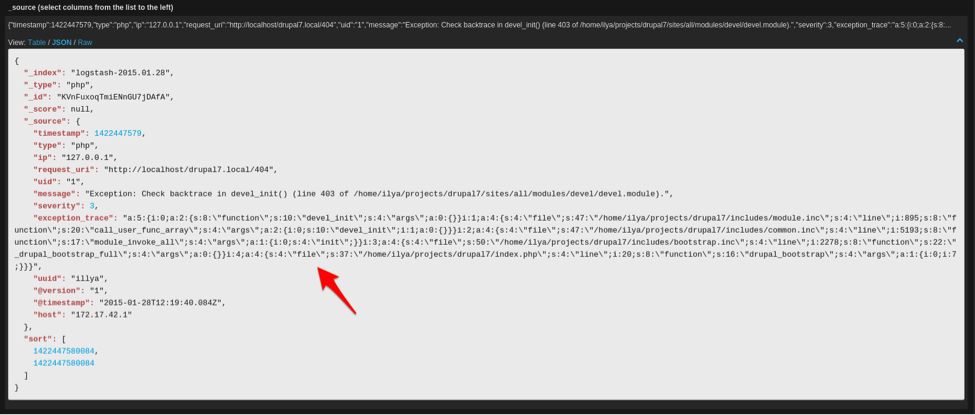 Figure 2: Logstash with a JSON coded message, capturing an exception
Since we want to concentrate our efforts on the actual development of the app (the same reason that led us to use services like Pantheon in the first place), we’ve decided to go with Loggly. The price is reasonable, and it provides many of the features we want, in particular the ability to send real-time email alerts.
Logs HTTP module
The Logs HTTP module takes over your exception handler, so whenever an exception is thrown, the backtrace debug_backtrace() of the request that caused the error is injected into the watchdog. This is super critical as it gives you a very clear insight to what caused the actual error. What triggered the error? That’s up to you to figure out. All the events that are sent via HTTP are sent in a PHP shutdown function, which means they won’t block your request. The module isn’t tightly coupled to the watchdog events, and you can use its API to send custom events.
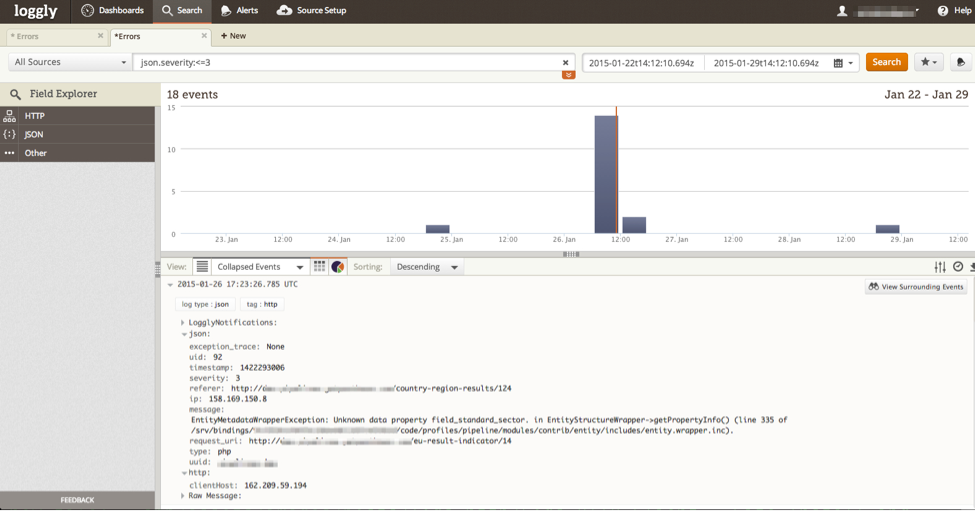 Figure 3: A saved search in Loggly, showing all the errors with severity of
 error or higher
Since a single Loggly account serves all our sites, we are using the Unique ID option in order to easily understand on which server the error occurred. The Unique ID can be filled out manually, but it could also be environment specific. For example, on Pantheon, we use this technique, which takes advantage of the $_ENV variable:
The Outcome
At Gizra, all our projects are connected to Loggly, where a simple alert has been set up. If an event with severity of error (or worth) gets triggered, it sends the developers an email, so we know in real time that we should start investigating.
Now all of our apps and sites have a phone to call home.
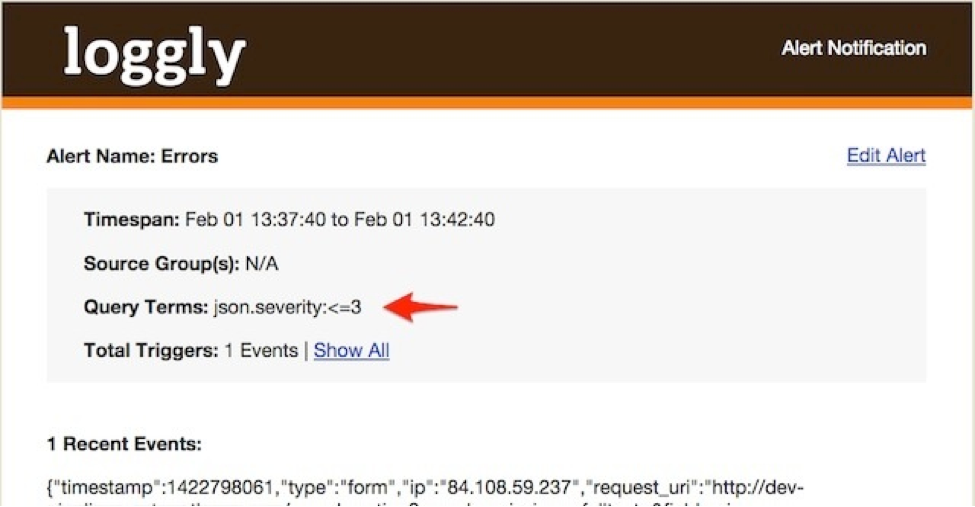
Figure 4: An email with an alert
Since Logs HTTP is an API module, you can still log specific events that are not in the severity level you have chosen. For example, if the severity level is error but you want to log all the watchdog events of a login event, you can:
And then in Loggly, you can have an alert with the query json.message:"Session opened for" NOT admin — which means you will be notified whenever a non admin logs in.
Conclusion
Like code review, automatic tests, and a proper deployment protocol, logging is an important part of the health of your application. With the Logs HTTP module, having this best practice implemented is only a few clicks away.
By Amitai Burstein, CTO and co-founder of Gizra.com. Follow Gizra on twitter: @gizra_drupal
The Loggly and SolarWinds trademarks, service marks, and logos are the exclusive property of SolarWinds Worldwide, LLC or its affiliates. All other trademarks are the property of their respective owners.

Amitai Burstein