EMR Series 3: Monitoring Amazon EMR logs in Loggly

Loggly® is a great way to monitor Amazon Elastic MapReduce (EMR) logs. A Software-as-a-Service (SaaS) log management solution from SolarWinds (a market leader in performance monitoring tools) Loggly is well known in the industry for being easy to use and integrate with a wide variety of application platforms. The solution offers a rich set of functionalities that store, search, and analyze logs generated from customers’ on-site or cloud-hosted IT infrastructures. Setting up Loggly to capture logs is simple, which you will soon see, and it will aggregate logs from your entire cluster and let you search for specific jobs. You can also set up dashboards and alerts to give you faster visibility when jobs fail or throw errors.
In the second part of this series, we set up an Amazon EMR cluster and ran some workload on it. One of the steps of the job failed, and we saw how to look for errors from that step’s log files. Because the process was manual, we mentioned that this could be simplified if EMR logs were consolidated in a centralised log management solution, such as Loggly. In this, the final part of the series, we will configure the SolarWinds® Loggly solution to capture all logs from our EMR cluster and use those logs for troubleshooting.
Loggly integration for Linux filesystem
Users can configure Loggly to capture any file from a Linux system and run a Loggly-provided shell script to configure automatic file and directory monitoring. Every time new lines are added to a log file, or a new log file is generated, its contents are automatically sent to Loggly. For this integration, the target system needs to be running syslog version 1.19 or higher, and TCP port 514 should be open.
This means the log file directory of an EMR master node can dynamically send its contents to Loggly. For the purpose of this post, we won’t be using Linux log file integration.
Loggly integration for S3
Loggly can also display uncompressed, line-separated files from Amazon S3.
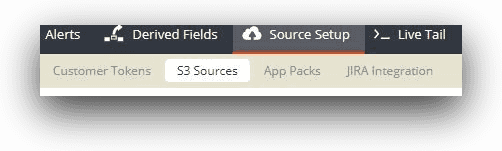
Users can configure one or more S3 buckets to send their file contents to Loggly. This option is available from the “S3 Sources” link under the “Source Setup” menu in Loggly.
The S3 integration can be accomplished by running a Loggly-supplied Python script, or you can follow a number of manual steps. Several components are configured for the integration behind the scenes. When successfully completed, the S3 integration is shown in Loggly with a green tick mark:
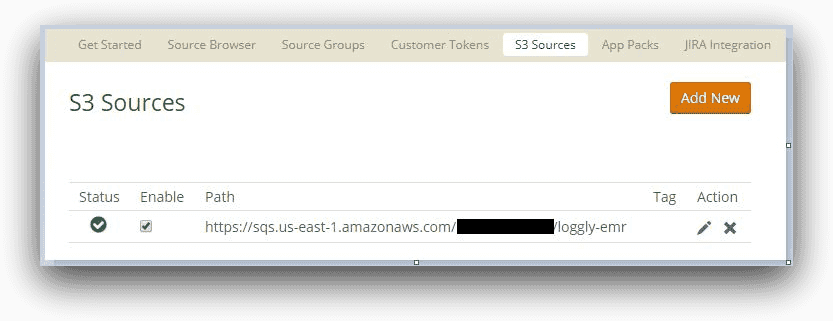
For our use case, we will configure the S3 bucket that our EMR cluster is using. This will enable the log folder to send log files to Loggly for ingestion. Once the steps are complete, we will be able to view these logs from the Loggly interface.
To see the true potential of Loggly as a monitoring tool, we will again deliberately fail one of the job steps. The logs for these job failures will be visualized through the new charting feature in Loggly. We will create two charts and add those charts to a dashboard. This dashboard will give us an idea about the job failure patterns.
Finally, we will create an alert for failed jobs and see how it can send custom messages across a number of delivery channels. The Loggly alerting functionality helps developers, administrators, and service operators stay on top of managing the performance of their applications.
Set up Loggly integration with S3
Setting up S3 integration for Loggly is a straightforward process. We followed the manual steps from the Loggly integration page for S3.
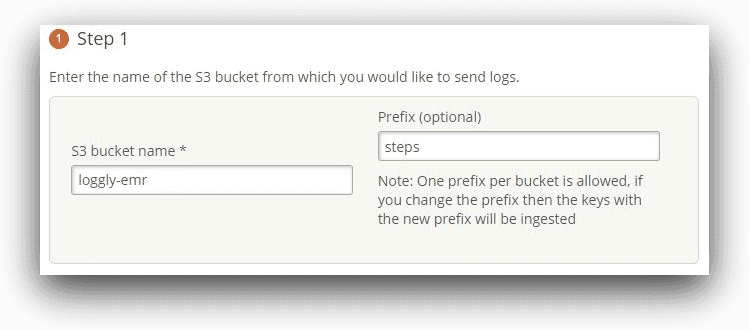
In our use case, we have configured a prefix of “steps” for our S3 integration. The steps subfolder contains the log files for a submitted job step.
Checking the log files using Loggly and creating search patterns
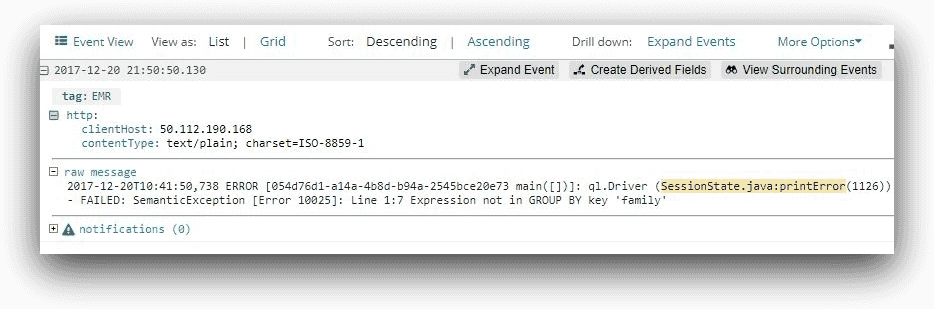
Roughly ten minutes after completing the set up of the integration, we should be able to use Loggly to search for the last part of this message trail:
“(SessionState.java:printError” with a time period of “last 30 minutes.”
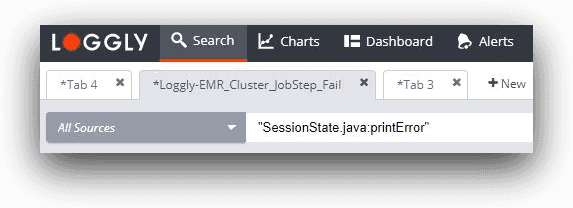
We should find our event in the console below and we see that the raw error message contains the text Expression not in GROUP BY key.
In this particular case, we cannot make use of the Loggly Dynamic Field Explorer (DFE) feature. With DFE, the Loggly parser automatically divides a log event into separate related fields. Sometimes these fields can be nested within other fields. This hierarchy enables users to drill down from a root event to sub-events. With DFE, users can easily select one or more fields from the search screen to build their query.
Unfortunately, the controller logs for the Hive job step are fairly unstructured, so we are using whole search terms.
Also, note that there is a time difference between EMR generating these logs and pushing them to S3 (every five minutes). That’s why we may notice that log events’ times in Loggly are different from those reported by EMR.
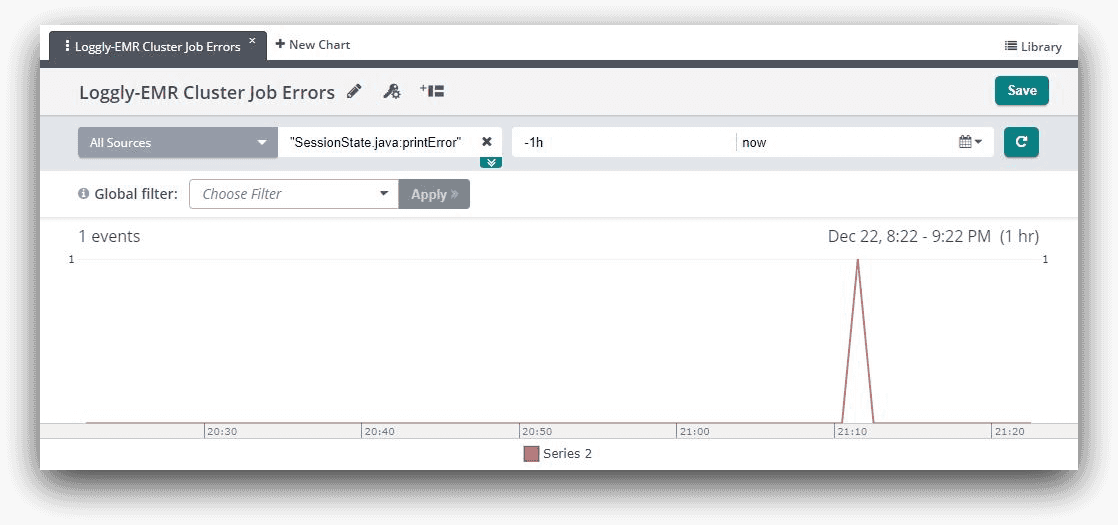
Creating charts
Using the Loggly 3.0 charting feature, we can export the chart view of the search screen to a new chart. This is shown in the image below:
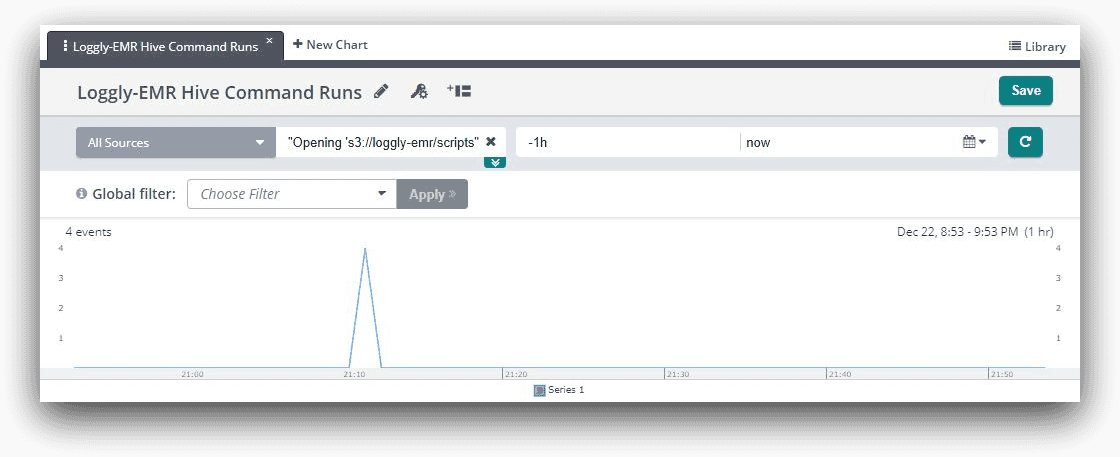
We can also create a chart that shows each time Hive loads a script file for execution. If we look at the controller log file for a job step, we will see a line like this:
| Opening ‘s3://loggly-emr/scripts/endangeredPlantSpecies.q’ for reading |
If we take part of the message as a search string, such as
“Opening ‘s3://loggly-emr/scripts”
it will show four events in Loggly. This is because our job was running four steps. And once again, we can export this into a chart:
Creating a dashboard
If we add both of the charts to a dashboard, we can correlate the job run with its error. The following image clearly shows this:
We can experiment with this further with our cluster. Remember how we ran a command called aws emr add-steps in our last article, where the command added four job steps? We can run this command a few times at regular intervals. The EMR steps console will show one step failing in each batch run:

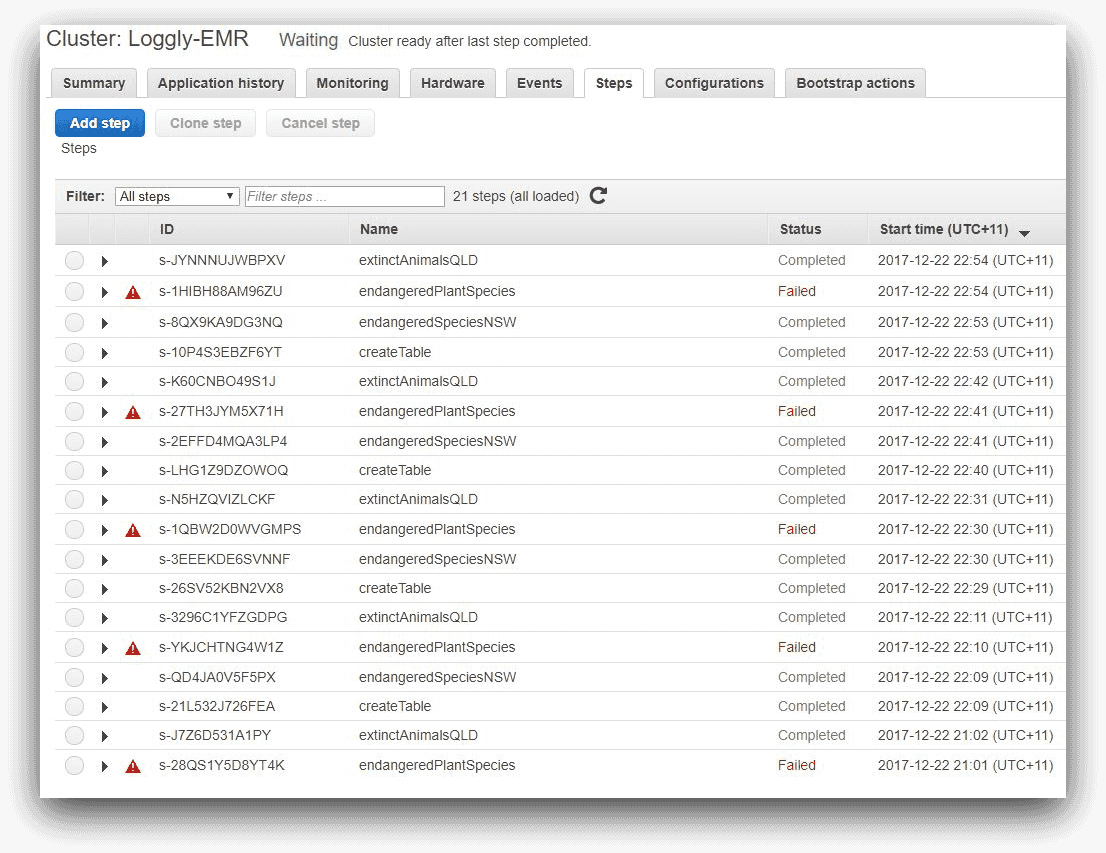
For each of these steps, the Hive log file will be updated. This means the count of the error message event will increase over time, and so will the count of the query file opening event. For each run of the batch of four steps, the error message count will increase by one, and the message of a file being opened will increase by four.
If we come back to the dashboard to see the performance status for the last hour, it will show the increase in count of events.
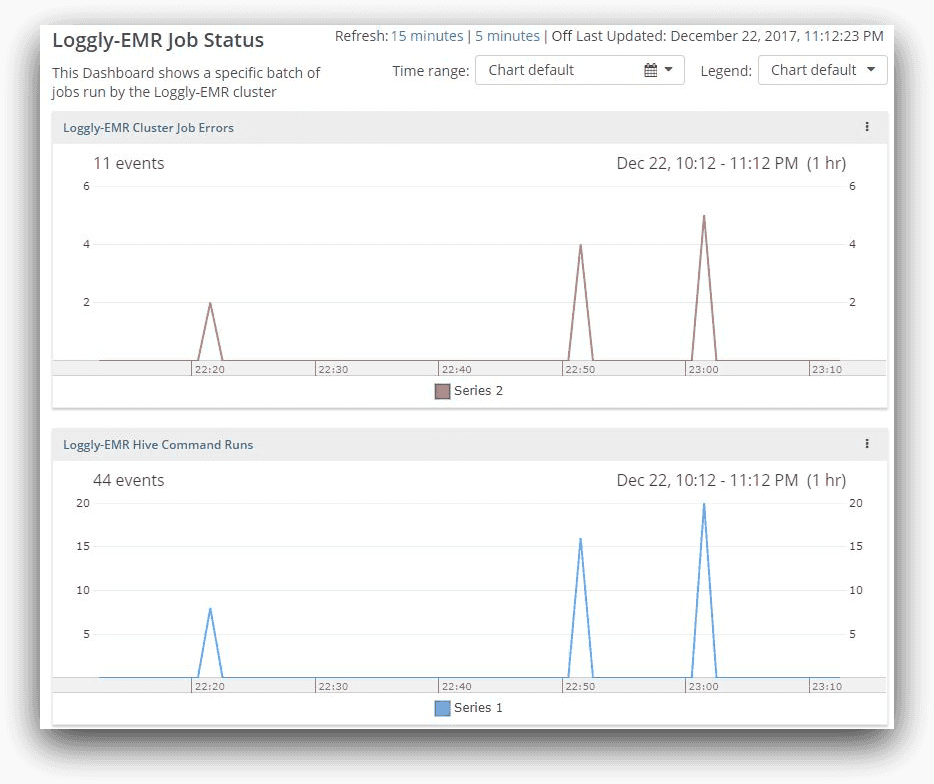
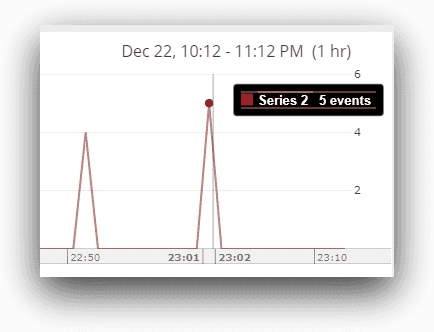
Here, in the last hour, Loggly finds two counts of the same error message. Then it finds four errors, which means two new failures plus two previous errors. The next scan shows five errors (one new error encountered since the last run). The cumulative count of error events (and not the number of errors) is shown as 11 (2 + 4 +5). The actual number of errors reported would be five. This will be evident if we hover the mouse over the last spike:
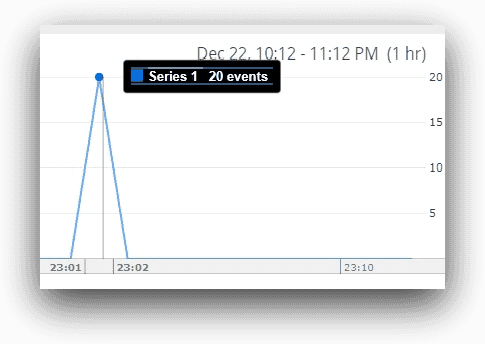
Similarly, the total event count for the steps running is shown to be 44, but that’s a cumulative figure. The actual number of events where query files are opened is 20 (4 events 5 batch runs), as shown below:
As we can see, there is a definite correlation between command runs and errors, because for each batch run, the error count is increasing. This tells us there is something wrong with our batch of jobs. Using similar techniques, big data administrators and developers can follow the performance trend lines of their applications.
How Loggly can alert on Hadoop job failures
The Loggly chart or dashboard is a great tool for monitoring application performance. However, this requires someone manually checking the console. Like all good monitoring tools, Loggly also offers an alerting mechanism based on a pre-defined search condition. Loggly can monitor log streams in intervals ranging from every five minutes to one day and send alerts when a search condition is met. The alert can send automated messages to PagerDuty, HipChat, Slack, email or a custom web application. With Loggly alerting, service operators never miss a critical application failure.
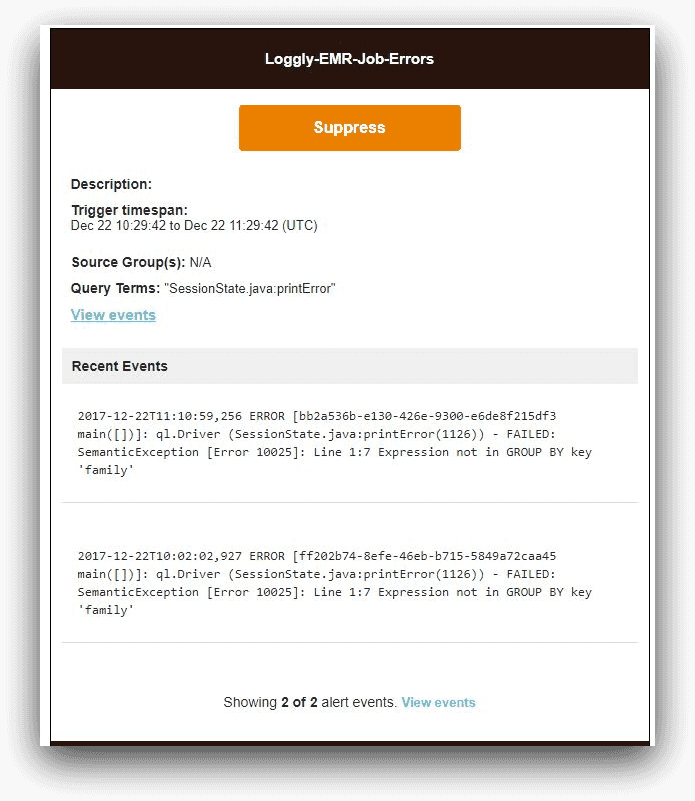
In the following image, we have set up an alert for the Loggly-EMR cluster, based on the search we did before.
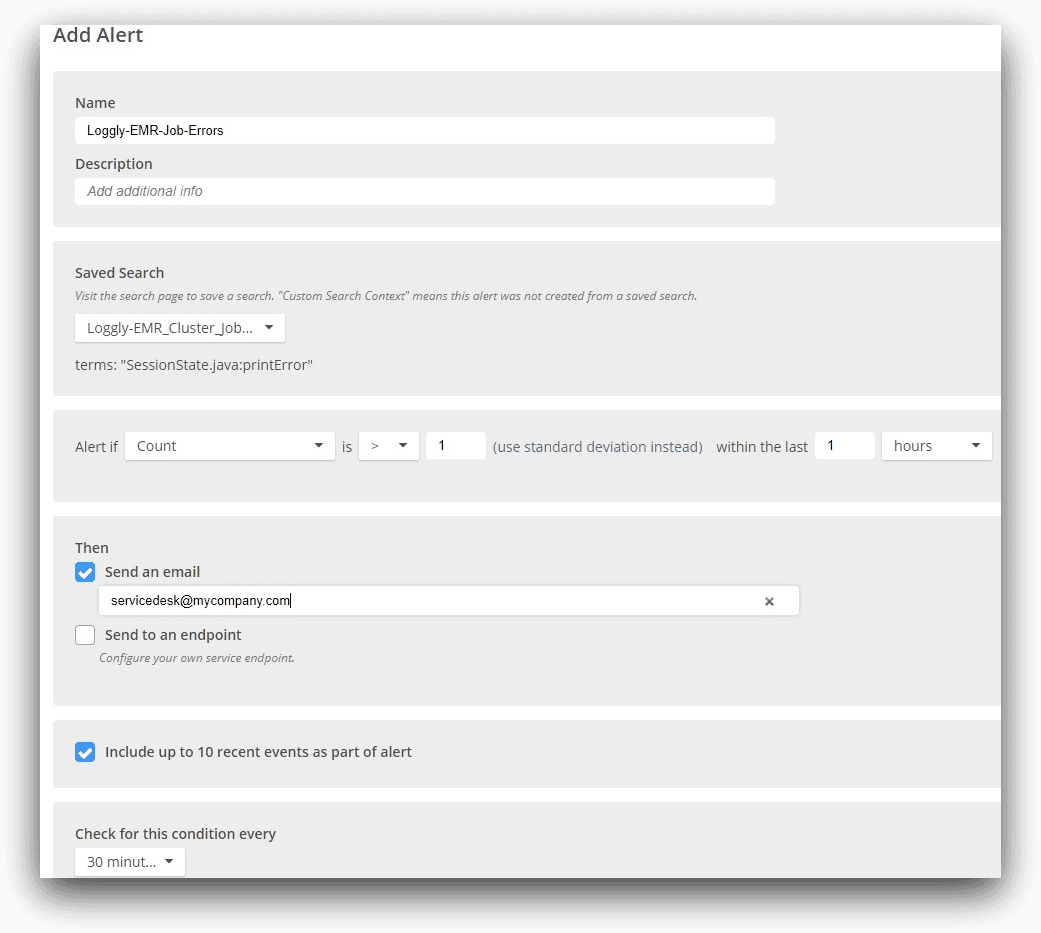
Note how we are specifying the saved search condition. For our use case, the alert email would look like this:
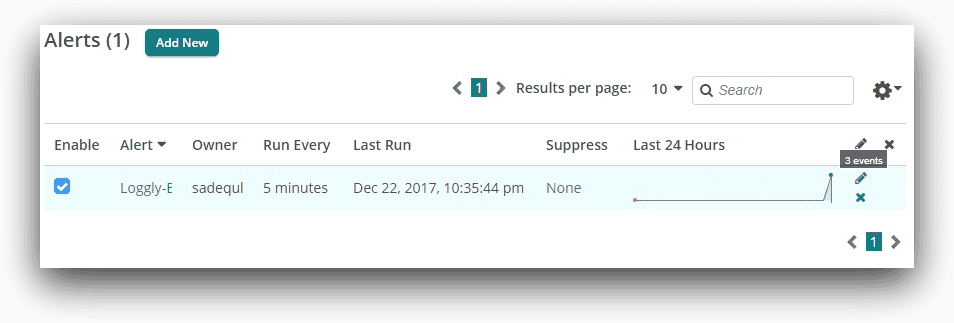
From the Loggly alert screen, we can also see how many times the alert has fired off:
Conclusion
In this article, we saw how to use SolarWinds Loggly to capture Hadoop logs from an Amazon EMR cluster. It’s easy with EMR because there’s already an S3 integration available from Loggly. Even if you are running another distribution of Hadoop, you still can use syslog or Linux file integration to ship the logs to Loggly.
Our use case was specific for Hive programs running in EMR. Typically, a Hadoop cluster will run different types of applications like Spark, Pig, or Impala. However, the concepts we described here can be used to trap errors from other applications, too. For example, Hadoop system administrators can set up their own saved searches, charts, dashboards, and alerts to track system level logs.
The Loggly solution gives you better visibility into EMR logs and helps you troubleshoot faster with centralized log management, easy searching with a powerful search engine, and the ability to create alerts when errors are found. Sign up for a free trial today!
The Loggly and SolarWinds trademarks, service marks, and logos are the exclusive property of SolarWinds Worldwide, LLC or its affiliates. All other trademarks are the property of their respective owners.

Sadequl Hussain