New Capabilities for Triaging and Reporting on PagerDuty Alerts Using Loggly
Alerting is critical to the 24×7, net-centric economy. It’s a way to minimize the impact of application problems on revenue and profits. At Loggly, we love PagerDuty because it has brought sanity to how we become aware of operational problems, assign the right resources to solve those problems, and follow them to completion. It answers the all-important “who” questions and is a perfect complement to the Loggly service, which gives DevOps teams a way to delve into the “why.” And that’s why we are expanding our PagerDuty integration capabilities. In this first post, I’ll talk about the most common use case: solving operational problems.
Triage and Find the Root Cause of Problems Faster
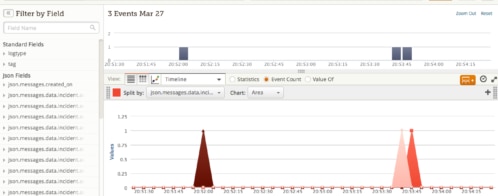
You’re out to dinner with friends and you receive an alert through PagerDuty. Your signup rate has dropped way below its usual level. This could indicate a serious problem with your site, but it could also just be an unusual traffic pattern. Should you leave the restaurant and rush home? Or would you just be sacrificing much-deserved downtime for something that could wait until tomorrow?
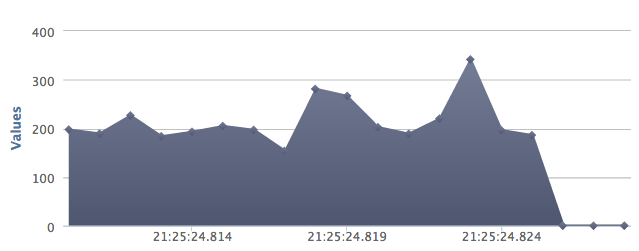
PagerDuty will tell you that an alert fired due to an unexpected decrease in signups. However, you need more information about what system they are coming from and who is responsible. You click on the alert and go straight to your Loggly dashboard, where you see that the alert fired at the exact same time that a deployment happened. So this is probably a real site problem. Time to get the check.
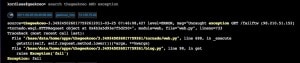
While you’re waiting, you search for your signup page logs. You see that clicks are being recorded but that calls aren’t consistently being sent to the back-end service. Later, some digging into the code shows you that the page isn’t rendering correctly in Internet Explorer browsers. You roll back the deployment, file a bug with the front-end team, and resolve the PagerDuty alert.
Loggly offers DevOps teams deeper visibility into their systems, both during initial assessment and triage and as they work to isolate and resolve their operational problems. You can quickly see correlations between an alert state and other things happening on your systems, and you have access to all of the data you need to find root causes. As a result, you can stop interrupting your day for small problems so you can focus on the big ones. And you can solve those big ones much faster.
Grow Your DevOps Cloud Toolbelt
Keeping your application up—and performing well—is the key to success for net-centric companies. Working together, PagerDuty and Loggly help your operations stay in top form, answering the “who” and “why” questions whenever potential problems crop up. So what’s in your DevOps toolbelt? If you don’t have a great end-to-end solution for alerting and log management, sign up for free trials of PagerDuty and Loggly today.
Hang out with Loggly, New Relic and PagerDuty tonight at DataBeat’s reception and have some Data-tinis on us!
The Loggly and SolarWinds trademarks, service marks, and logos are the exclusive property of SolarWinds Worldwide, LLC or its affiliates. All other trademarks are the property of their respective owners.

Jason Skowronski