Which Components of Your System Should You Log?
The Logging Conundrum
Two of the most common questions we get from our users is which components should they log and how should they prioritize the amount of log data to collect.
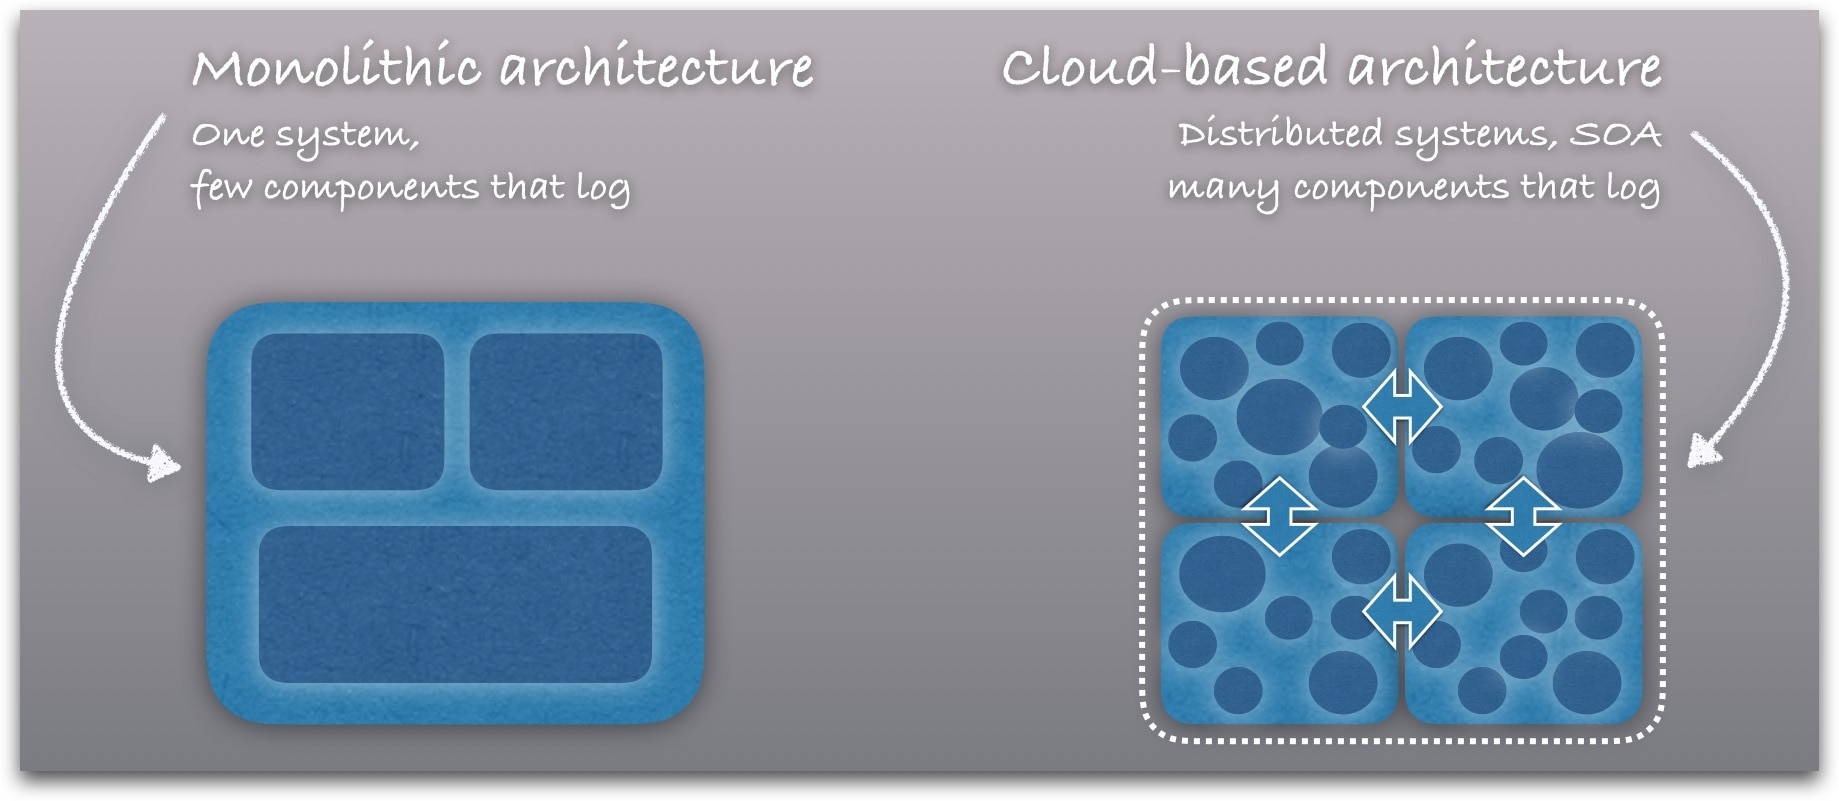
If you’re like most software businesses, you’re probably running a complex system with many components and distributed services. For each component, you should ask yourself three questions:
- Does it log?
- If it doesn’t log, should it?
- Should its logs be centralized in a log management service like Loggly?
Of course, logs are like gold when you have a problem to solve, so generally speaking, having more of them is better. At the same time, not all log data is created equal. And capturing and storing log data comes with some costs. In this post, I’ll explore both strategic questions and practical use cases that will help you find the right balance.
The Big Picture: Logging Fosters the DevOps Mindset
If you’re embracing the wonderful world of DevOps, you know that one of the most important principles is getting everyone in development and operations on the same page. To get on the same page, everyone needs a holistic view of what’s happening across every component in the stack. So it pays to log at multiple levels.
Yet, many customers tell us that their application logs are the only ones that really matter, and those are the only ones they collect and centralize in a log management solution like Loggly. At the end of the day, the application is what powers their business: It’s what their customers see, and a quick look at their support statistics shows that the majority of problems occur within application code.
The question is, though: Where does your application start and where does it end? Is it, say, the Java code written by your developers? Most people will likely say that the Java runtime environment is also a crucial part, and typically we see people collect those logs as well.
The web server? Yes. Databases used by the application? Maybe. Here we already see users who don’t include the database logs into what they send to Loggly. Operating system, hypervisor, components of the cloud infrastructure? Storage backend? That’s where it starts to get spotty. Load balancers, switches, routers? A lot of people seem to assume that the more low-level it gets, the less need they have to centrally collect and manage log data.
Reasons given for abandoning such log sources:
- These components are perceived to be (for the most part) reliable.
- They typically come with their own log monitoring solution.
Thus, sending their log data to a central log management solution like Loggly is not considered necessary. Some users even see them as adding “noise.” They monitor their application logs in Loggly, and if they need to look at the logs of their router or AWS Linux instances, they go to the router’s web front end or check in AWS CloudWatch.
Instead of making all log data easily accessible to every member of a DevOps organization, there might be a network team that is the only one that has access to (and is familiar with) the proprietary monitoring solution of the network switches or load balancers. The storage team knows how to access the monitoring tool of the RAID systems. All logs in one place, easy to access by all groups and individuals so that all eyeballs can look at a problem if needed? Not really.
The biggest problem with this approach is that as long as you maintain these “log silos,” you will not be able to get a cohesive, in-context view of everything that makes your application run. And the assumption that these more low-level components “usually work” can be fatal to your business. What happens if you get hit by a rare corner case defect or a well-disguised malware or hacker attack? Chances for that might be (or seem) low, but IF they hit you, chances that they do significant damage are exceptionally high. It’s a bit like that fire insurance that you buy even though you never had a fire in your home.
Where Log Data Fits into DevOps Processes
Because log data is the universal element across every component and every layer, centralizing all your log data is integral to:
- Troubleshooting problems faster and bringing in the right people as early as possible.
- Monitoring for issues at all levels in the stack. There are a ton of monitoring tools out there, but many of them actually create silos of users instead of breaking those silos down. Having your teams looking at (and learning) multiple tools and trying to compare their output will not reduce, but increase MTTR.
- Continuous code deployment with confidence. Log management should be part of your CI test cycle. The more cohesive your test scenarios are, the more components you need to log.
Making the fruits of this analysis accessible to everyone who’s working on a problem – for example, by sharing relevant searches or metrics through HipChat or Slack workspaces where developers and ops people collaborate – goes a long way towards fostering a DevOps mindset.
But What about All That Noise?
Yes, adding more log sources to your central log management will increase “noise” in the way that, even when things go normally, you end up with more log data. Yes, there’s cost associated with that. And yes, even during those “common” incidents you might never touch certain logs.
But it’s the unexpected and less common cases that will hurt you. The noise argument is indeed a very poor one when you use a modern log management solution (be it Loggly or another). There are many ways to filter logs. Loggly’s Dynamic Field Explorer automatically breaks logs down into fields and groups. You can use dashboards to monitor your most relevant metrics. Saved searches and filters shine light on whatever subset of information you want to focus on. Check out Loggly Source Groups: They allow you to group logs by different criteria. For example, you can look at your application logs only, or at logs from one specific server, or cleanly separate the logs from your staging and production environments.
To stick with my home fire analogy, the argument of “too much log noise” is a bit like buying a fire extinguisher that’s only 20% full. You do it because it’s cheaper and lighter and because you assume you will only have to fight small fires.
Aren’t You Promoting Log Overkill?
No. Consolidating and centrally managing all your logs is different from logging each and every event. The question of what events to record and how much you log is an entirely different problem, which needs consideration as to what the right level of information is or if intensive logging will have performance implications. These questions typically need to be answered for every component of your system. For many (if not most) components, you will probably stick with their defaults.
In a nutshell, you don’t need to log everything, but everything that you do log should be centrally collected and managed.
Performance Problems? Lubrication Problems!
An example that illustrates all this nicely is the case of a Loggly user, a startup in the gaming industry. This company offers a commercial online game that requires intense database and storage I/O resources in the backend. One day, performance problems occurred, with players complaining on social media and leaving the game. A look at the logs seemed to show the database as the culprit. The teams also checked the storage systems (an off-the-shelf RAID solution hosted locally) used by the database. These RAID systems’ logs were not sent to Loggly; instead, the storage experts on the team used the proprietary web-based monitoring tool with which the systems were shipped. And that showed all storage systems green.
While still investigating the actual root cause, that RAID monitoring system suddenly and unexpectedly went from green to red: too many disks failing even for the RAID to recover. Some continued to work, while others died completely; it seemed random and it happened fast. In a desperate rush and unsure if this was the result from an attack, the customer decided to take all storage systems offline, good or bad, replace them with new ones, and restore from backup — resulting in a 100+ hour total outage, and a second-to-none fire drill for this customer’s operation and dev teams. A PR nightmare came as a bonus on top of that, not to mention the lost revenue and money spent on new hardware.
Only as part of the post mortem analysis did the engineers look at the kernel logs of the Linux Operating System that powered the defective RAID units. The logs showed a crystal clear pattern of I/O issues reported by the disk driver. These errors had started to occur months ago and had slowly but steadily increased to the point where too many disks became nonfunctional. Unfortunately, the storage system’s own monitoring tool was not sophisticated enough to discover and report this issue at an early stage. It only showed red flags when a certain threshold was crossed and entire disks or arrays were threatened.
The actual kernel logs also showed that only a certain disk brand and model was affected. After checking in with the manufacturer, it turned out that certain batches of this particular model had an issue with the lubrication in the disk’s spindle bearings evaporating. No recall had gone out yet; the customer had the bad luck to be among the “early adopters” of this hardware bug. Suddenly it became clear why some disks had failed while others continued to work fine. It all made sense.
Ironically, the Linux kernel logs had shown these I/O disk errors increasing weeks before they became a problem. Comparing time stamps from the database logs also showed that these errors always preceded the database’s performance hiccups. Loggly Anomaly Detection could have caught the unusual increase in disk errors, as it reports deviations from statistical averages. The engineers could have investigated in the very same way they did as part of the post mortem. But the kernel logs of the disk arrays were not sent to Loggly.
A total corner case? Maybe. But again, it’s just like with home fires. I have never had one. I have never had an electrical appliance cause a fire. Yet, electrical failures or malfunctions were factors in one of every eight reported home fires, caused one of every six home fire deaths, and 20% of the direct property damage from home fires (according to the National Fire Protection Association). I will keep my fire insurance and I will make sure those smoke detectors work.
Our industry doesn’t track similar statistics for system outages that could have been prevented by more cohesive log data analysis, but I’m sure they would be alarming.
The Loggly and SolarWinds trademarks, service marks, and logos are the exclusive property of SolarWinds Worldwide, LLC or its affiliates. All other trademarks are the property of their respective owners.

Sven Dummer