Technical Resources
Educational Resources
APM Integrated Experience
Connect with Us
As distributed systems like Kafka are becoming more prevalent, with thousands of companies using them, the need for advanced monitoring is increasing.
In this post, we’ll learn what Apache Kafka is, why it’s important to monitor it, and what tools are best for the task.
Apache Kafka is a publish/subscribe messaging platform that helps us stream data into servers. To get a better grasp of this definition, let’s break it down a bit. Streaming is the process of publishing data from sources like web logs and sensor data into a cluster of servers. We can process this data as it’s coming into the cluster in real time.
One problem of the streaming process is how to get data from multiple sources into our cluster with reliability. Kafka solves this problem by letting us ingest data from a plethora of different sources, called “publishers” or “producers,” and storing it into topics. Topics are essentially streams of data. From there, target systems—for example, a database system or an analytics system—subscribe to a topic and receive or consume the data as it’s published. In other words, with Kafka, we can decouple our data streams and our systems.
Kafka can handle a large amount of data. We can add servers into the Kafka cluster and the system will scale well. Furthermore, it has great performance. The delay time of exchanging data between systems is so small, we consider it to be happening in real time.
Lastly, because Kafka stores the data, even if for some reason the data flow stops, it can resume from the point it left off, making Kafka fault-tolerant and reliable.

Now that we’ve seen what Kafka is, it’s important to understand why it’s crucial to monitor it. Kafka delivers data in real time, and highly interactive applications use it. These applications rely on Kafka to stay up to date. Therefore, it’s important to find and fix any problems before they even happen, because they’re visible and we don’t want end users to notice them.
The performance of business applications depends on Kafka. If a Kafka server is slow, for example, we should be able to understand why this is happening, because it affects our performance. Monitoring Kafka’s performance helps us answer similar questions, so we can stay ahead of business requirements.
As we saw earlier, Kafka architecture consists of many components. With all these Kafka components, there are also many metrics that need monitoring, which makes it a challenging task. For example, we have:
Of course, the above cover only a few of the numerous metrics we can monitor to examine if a Kafka system is healthy.
Next, we’ll take a look at tools that can help us tame this complex process of monitoring Kafka without wasting valuable time and human resources.
In a nutshell, logs are immutable sequences of records, and each sequence has a distinctive identifier.
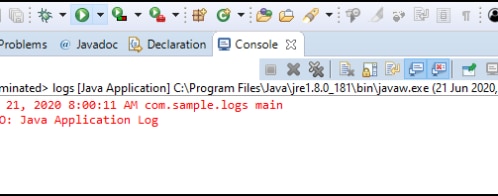
Logs play an important role in software development, and many technologies like analytics platforms or versioning control systems rely heavily on them. The main benefit of logs is we have a clear view of what happened in a system, in what order, and if everything is working as planned.
In Kafka, within each topic, every partition stores records in a log-type directory. Partitions are further divided into one or more segments, which are a collection of messages. From there, Kafka separates these collections into chunks of segments instead of keeping all of them in a single file. Log segments have a predetermined size and time limit, and when one of them is reached, the segment closes and a new one becomes active.
By using logs, Kafka can handle huge amounts of data compared to relational databases. Data is stored in ordered events, and the simplicity of the logs architecture makes them fast and efficient. Also, Kafka logs add consistency to distributed systems. They’re a great solution for systems consisting of many components, because their sequential characteristic ensures one component won’t accidentally override another. Finally, we saw earlier in Kafka, even if a component stops working, the system will continue to operate. Because of logs, Kafka is fault-tolerant and reliable.

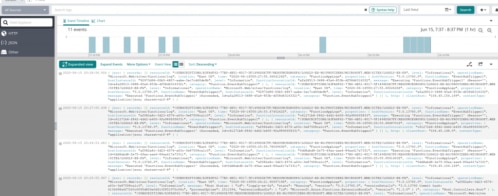
Monitoring Kafka components can help solve problems that might occur during production. With Kafka logs, you can examine if a system is generating errors, if a Kafka server isn’t responsive, and the general health of a system. Therefore, having a tool to helps monitor logs and alert you of any potential problems is necessary.
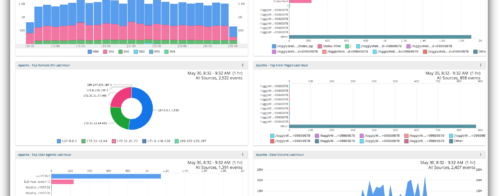
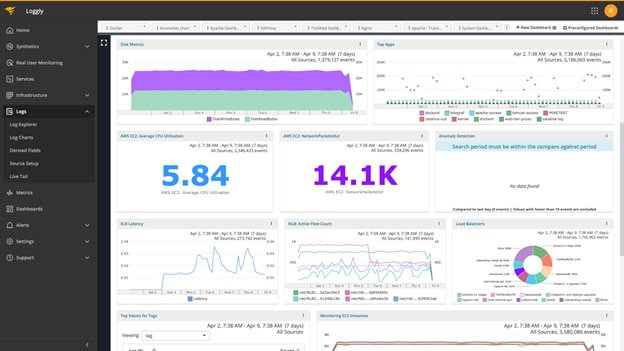
Loggly is one of the best solutions for monitoring Kafka logs with speed and efficiency. SolarWinds® Loggly® has clear, interactive dashboards divided into sections, making it easy to use and understand. The dashboards connect data from dozens of sources and provide a centralized view. Loggly has flexible, detailed graphs for clear data presentation, including KPIs and statistics.
Of course, benefits from using Loggly dashboards go beyond visual aid. Distributed teams can share dashboards and copy and modify graphs. This leads to better team collaboration that ultimately results in a better understanding of the data.
Loggly also has advanced reporting features. Every log dashboard can turn into a report. From there, team members can share them either via email or various business communication platforms. These reports increase visibility and ensure involved parties are on the same page.
You can find an in-depth guide on how to monitor Kafka with Loggly here.
Have you tried Loggly yet? Visit the Loggly demo page here to get started.
With SolarWinds AppOptics™, you can monitor and analyze metrics from Kafka. It allows you to troubleshoot any potential performance issues.
More specifically:
You can find all the advantages of monitoring Kafka with AppOptics here.
Users of Loggly and AppOptics have the opportunity to monitor metrics, traces, and logs from a single platform. This further increases your monitoring capabilities, speeds up the process, and simplifies identifying issues and troubleshooting your application. Using AppOptics and Loggly together improves your KPI visibility with advanced alerts and visualizations from AppOptics, while Loggly provides detailed insights into the root cause of the issues.
If you aren’t using SolarWinds monitoring products yet, sign up for a trial here.
This post was written by Alex Doukas. Alex’s main area of expertise is web development and everything that comes along with it. He also has extensive knowledge of topics such as UX design, big data, social media marketing, and SEO tec
Still searching? You may be interested in the SolarWinds Apache Web Server Monitor