Monitoring Kafka with Loggly
Apache Kafka is an open-source stream-processing software platform, written in Java and Scala, that reliably processes trillions of events per day between systems or applications. It allows you to build real-time streaming data pipelines. High throughput, low latency, built-in partitioning, replication, and fault-tolerance are a few of the reasons Kafka has caught people’s attention. Currently, thousands of companies are built on Apache Kafka, including Uber, Twitter, LinkedIn, Yahoo, Cisco, Goldman Sachs, and more. SolarWinds® LogglyTM even uses Kafka in its own data pipeline.
Apache Kafka is increasingly becoming a critical component of many companies’ infrastructures. It’s important that Kafka remains available with high reliability when used as a message broker. Problems like poor performance, a degradation in the Kafka broker health, lagging consumers, or even performance issues in the Zookeeper cluster can create rippling effects across your entire stack. You need to monitor all the components of Kafka so that your operations team can respond quickly during production issues.
Kafka logs contain valuable data on the health of the system. You can identify issues using logs if there is a broker down or if it is generating errors at a high rate. We’ll show you how Loggly can help monitor Kafka logs and alert you to problems.
Visualize Your Kafka Logs
SolarWinds LogglyTM is a Software-as-a-Service (SaaS) log management solution that provides you with rich features for analyzing your log data. You can easily search for errors and examine trends in the logs with charts and dashboards. For example, you can create a dashboard for the Kafka log types and severity counts, as shown in the screenshot below.
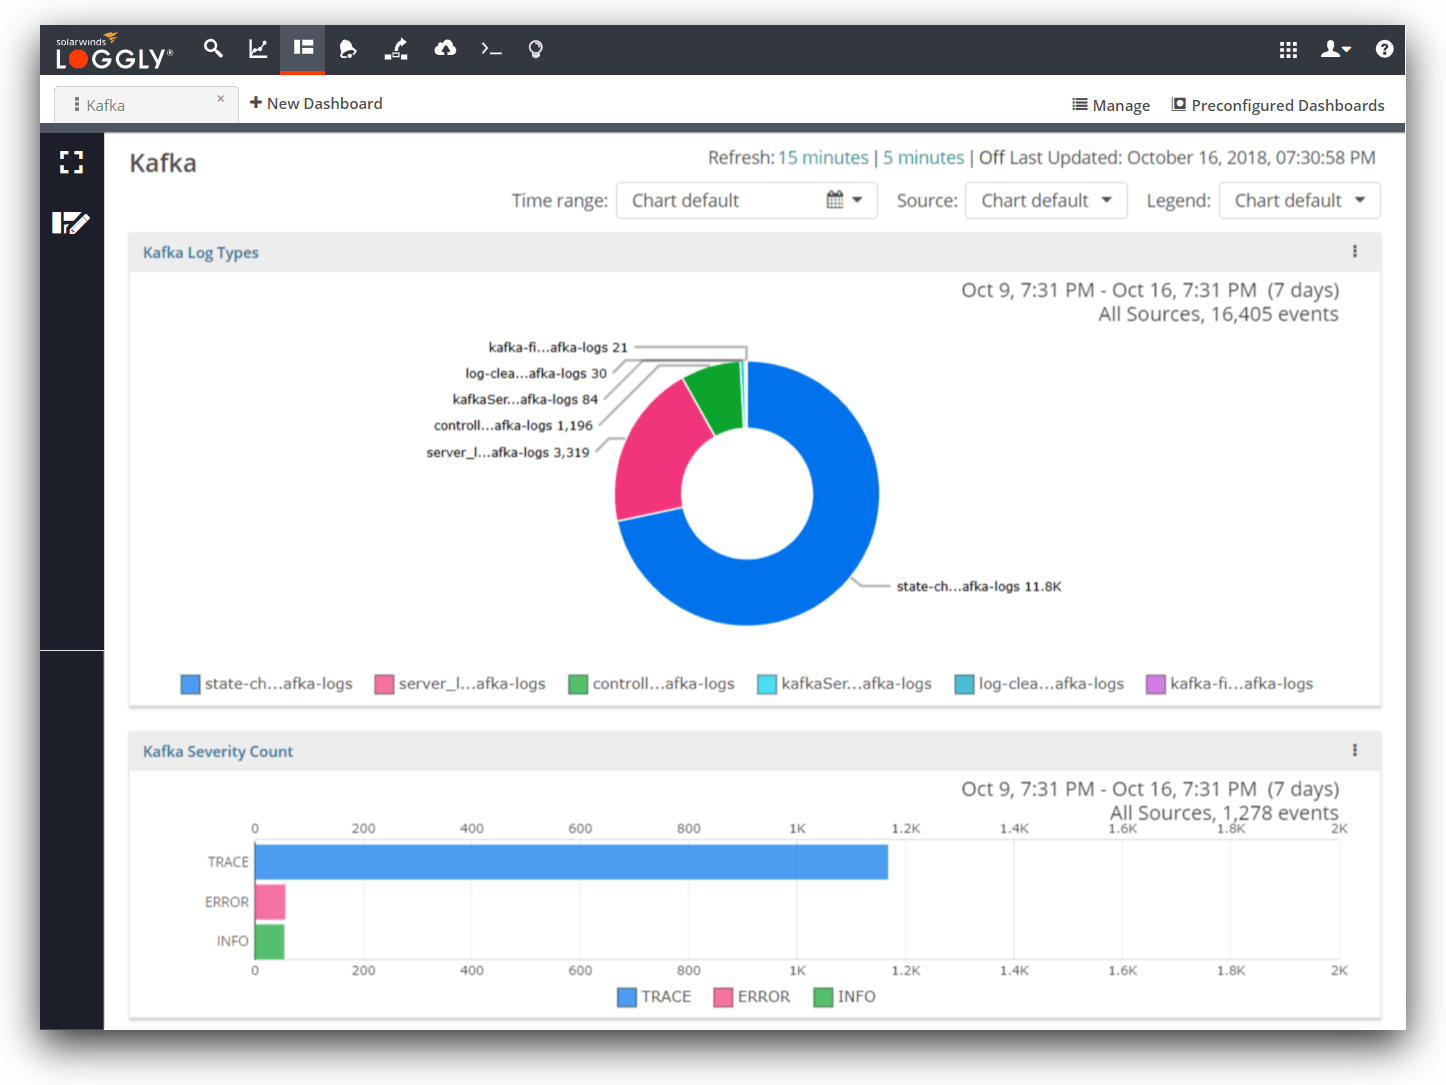
The log type chart shown above lists the file names of the logs that are received by Loggly. Kafka creates many log files in its local directory that contain the working status of Kafka, including Kafka-controller, Kafka-server, kafka-utils, state-change, and log-cleaner. In Loggly, if you place your cursor on the pie chart, it will display the name of the log file along with the percentage share.
The severity chart will help you track the severity of log events. In an ideal world, you wouldn’t have any errors. When you do get errors, you can click on the error bar to search for them on the search page. Then you can look at the surrounding logs to identify the root cause.
Examining the Logs of a Failed Server
Let’s look at an example of what happens when we shut down the Kafka server. The consumers are no longer able to contact the server, so they are unable to commit updates to the message offset. When that happens, you’ll see a log like the one below:
[Consumer clientId=consumer-1, groupId=console-consumer-29502] Offset commit failed on partition test-0 at offset 53: This is not the correct coordinator. (org.apache.kafka.clients.consumer.internals.ConsumerCoordinator)You’ll also see errors for partitions going offline. Each broker holds n / (number of brokers) partitions for each topic, and when the broker goes down, all the topic partitions go down along with it.
Initiated state change for partition __consumer_offsets-48 from OfflinePartition to OnlinePartition failed (state.change.logger)When the broker goes down, producers will need to fall back to live partitions in order to write data. After that, a leader election starts for each partition.
[Consumer clientId=consumer-1, groupId=console-consumer-29502] Error while fetching metadata with correlation id 491 : {test=LEADER_NOT_AVAILABLE} (org.apache.kafka.clients.NetworkClient)
Started leader election for partition __consumer_offsets-23 (state.change.logger)
If a new leader is available, the system will recover. If we see many errors like this in a row, it may indicate that no server is available to be the leader. The system may permanently fail until the operations team takes action.
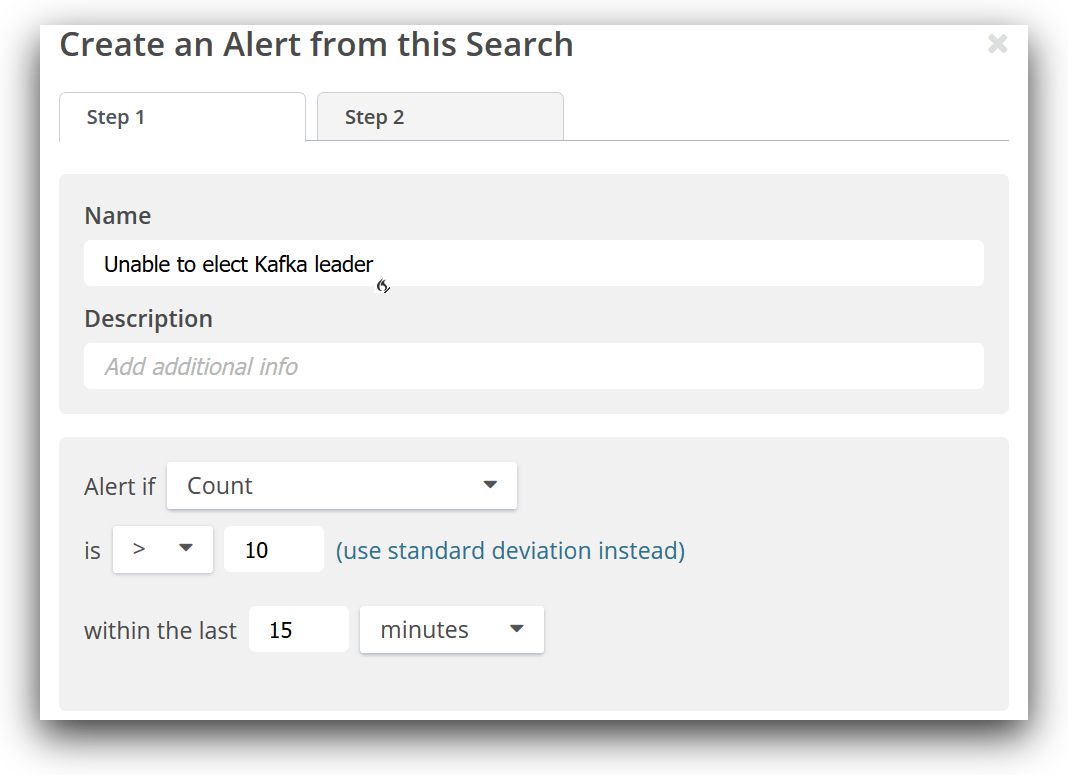
Your operations team needs to know right away when there are critical errors like being unable to elect a leader. You can create an alert based on a search. Loggly supports various alert endpoints and can notify your team via Slack, Hipchat, PagerDuty, and more.
Sending Kafka Logs to Loggly
Loggly offers a convenient file monitoring script that will automatically configure your system syslog daemon to send logs to Loggly. This setup requires the Rsyslog daemon to be installed in your system, and it’s installed by default on most Linux distributions. Rsyslog then relays the file logs securely to Loggly. To apply file monitoring, you can use the command shown below.
In our example, the logs are stored in /opt/kafka/logs, so we’ll monitor the files in this directory. You should identify the appropriate directory on your own systems.
Command line parameters for the script:
|
REPLACE:
SUBDOMAIN: Loggly account’s domain name that you created when you signed up
USERNAME: your Loggly username, which is visible at the top right of the Loggly console
FILENAME: the file or directory path you want to monitor can contain wildcards but cannot contain spaces. In our example, it’s /opt/kafka/logs.
ALIAS: an easy to recognize name for this group of logs. Will append to the syslog.appname field along with the filename.
TAG: an optional flag to associate some tag value in the logs. Add a tag for “Kafka” to easily find the logs when searching.
Example Command:
|
Now the events will be searchable with the search query below.
|
You will be able to see the events in Loggly search as below.
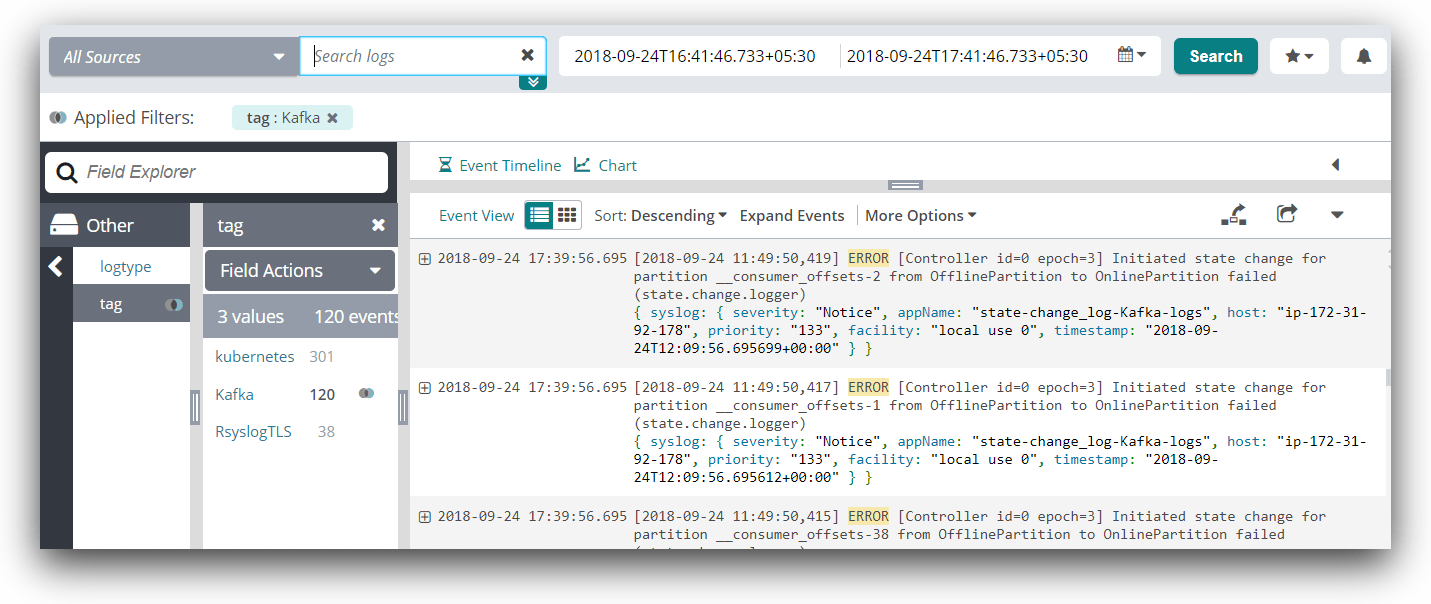
Now that the logs are available in Loggly, you can create dashboards and alerts to monitor problems in near real time.
Parsing Kafka Logs
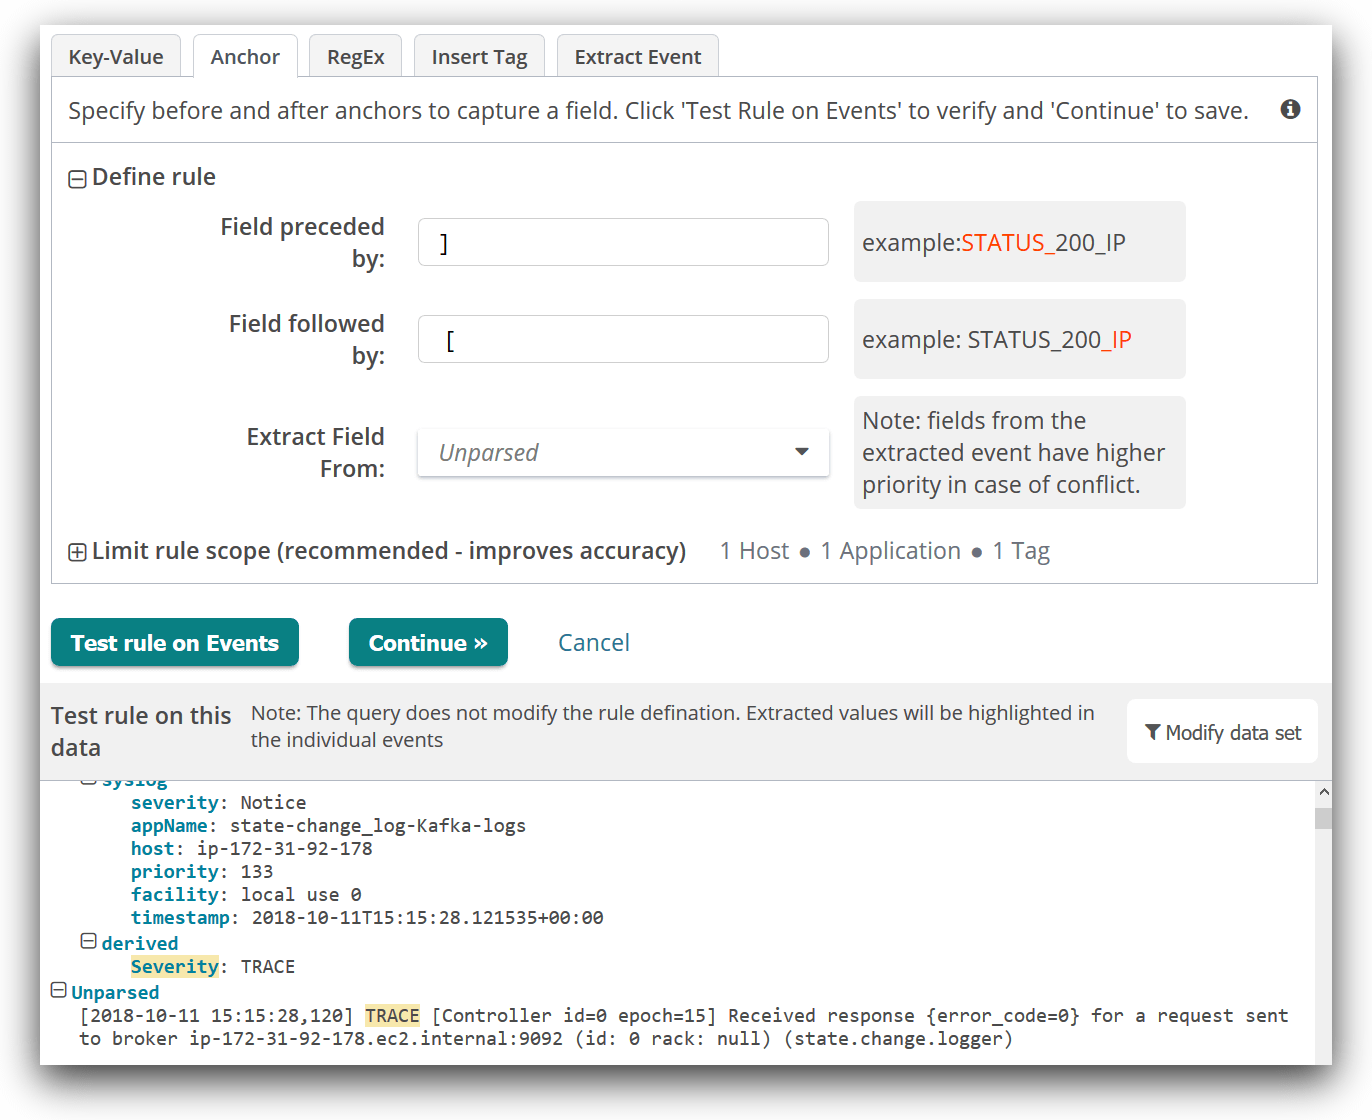
Loggly can also help you parse Kafka logs using Derived Fields. This feature allows you to extract field values from your log events. Fields are structured data that help you do log analysis on aggregated data and create visualizations like those shown in the dashboard above.
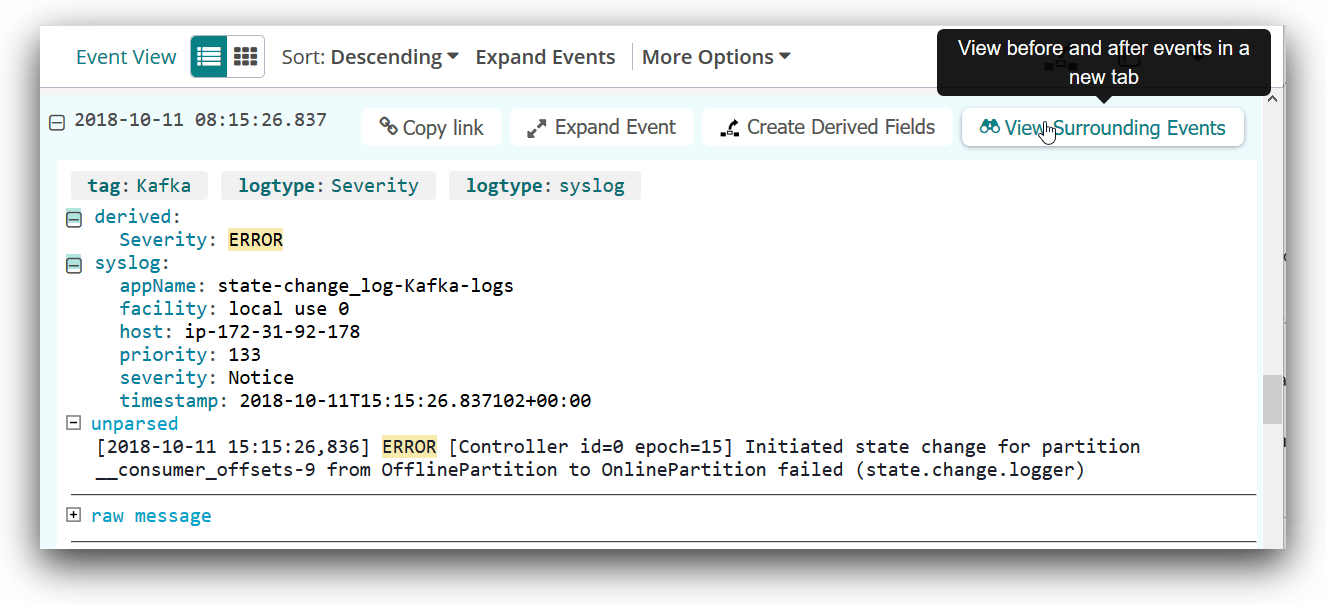
In the example below, you can see how we are using an anchor rule to parse the severity of the log event from between the square brackets. The severity is highlighted in yellow. If we wanted, we could also parse out the controller ID, epoch, the broker domain name, and more.
Conclusion
As more people are using Apache Kafka in the back end of their systems, it has become necessary to monitor its performance. SolarWinds Loggly allows you to analyze logs from the consumers, brokers, producers, and zookeeper. It allows you to parse logs to extract fields from the data and create summary statistics. When errors reach a threshold that indicates a potential loss of availability, you will be the first to know, thanks to dashboards and alerts. You’ll also be able to examine the error message along with surrounding logs to identify the root cause of problems.
Learn more about how Loggly can give you frustration-free log management in the cloud, then sign up for a trial or the free plan to get started.
The Loggly and SolarWinds trademarks, service marks, and logos are the exclusive property of SolarWinds Worldwide, LLC or its affiliates. All other trademarks are the property of their respective owners.

Jason Skowronski