Sending Amazon CloudWatch Logs to Loggly with AWS Lambda
Amazon CloudWatch 101
Amazon CloudWatch from Amazon Web Services (AWS) is a web service for monitoring the performance of other AWS-hosted resources. For each type of service, Amazon CloudWatch exposes a number of performance counters specific to that service. For example, some performance counters for Amazon EC2 instances include CPU usage, NetworkIn, NetworkOut, and Read and Write Ops. Users can see historical performance trends from these counters and create alerts based on their values.
One of the newer features of Amazon CloudWatch is its ability to capture logs from Amazon EC2 instances, AWS Lambda functions, or AWS CloudTrail. With Amazon EC2, Amazon CloudWatch can capture operating system events from syslog or Windows event log, as well as events from applications like Nginx, Apache, or MongoDB. CloudWatch enables users to group similar “streams” of logs under log groups and apply retention policies on those log groups. Other than searching through the logs, AWS customers can now create metric filters on the log data and specify alerts on those filters. Going one step further, these metric filter graphs can also be used to create custom dashboards.
Loggly vs. Amazon CloudWatch Logs: A Tale of Two Log Managers
Loggly is a Software-as-a-Service (SaaS) log management solution that can store, analyze, and report on large volumes of log data collected from a wide variety of sources. Its standards-based log collection functionality makes it easy for customers to send their application logs to Loggly via syslog or HTTP.
Loggly offers:
- A single, centralized location for storing all types of logs
- Visual views of log data in an easy-to-navigate JSON format into which users can drill down to find specific information
- Powerful filtering capability and saved searches for later reuse
- The ability to analyze historical data to help detect anomalies within logs
Compared to Loggly, Amazon CloudWatch logs may have fewer features, but both solutions can play a role in troubleshooting. Also, there are situations when systems may not be able to send logs directly to Loggly. Let’s look at some examples:
Servers and Applications Without Connectivity to a Syslog Server
Not all servers or applications may be connected to the Internet and perhaps not even to a syslog server. Even if the server sends its logs to a syslog server, that machine could also be disconnected from the Internet. A typical example would be database servers like SQL Server or MongoDB running in EC2 instances. These servers typically sit behind a firewall or a protected network segment without any connection to the outside world. Nevertheless, you would like to capture and save logs from those applications and ideally keep them in one place.
The answer here could be Amazon CloudWatch logs. Since Amazon CloudWatch is not tied to specific VPCs, instances, or network firewalls, there’s nothing stopping us from sending logs from AWS-hosted resources to Amazon CloudWatch.
Creating a Single View of a Hybrid Cloud Environment
Another example is a hybrid cloud architecture where you want to aggregate and analyze data from both your cloud and on-premise servers. Here, Amazon CloudWatch can take care of logging from the AWS side, while Loggly can capture logs from the on-premise network.
The Obvious Problem
However, given the option, most IT shops would prefer to use a unified logging solution. It quickly becomes an overhead when Sys Ops and DevOps engineers need to keep an eye on more than one source of truth. Unlike other sources like syslog, there is no native integration between Amazon CloudWatch logs and Loggly. This is where AWS Lambda can help.
Introducing the AWS Lambda Blueprint from Loggly
AWS Lambda is a recent addition to Amazon’s cloud platform and has quickly become very popular with developers for its flexibility and power. It’s a compute service in a Platform-as-a-Service (PaaS) model where users can run their custom code without managing the underlying server infrastructure.
With AWS Lambda, AWS has taken away the headache of spinning up and configuring dedicated Amazon EC2 hosts for running custom code. Instead, the user uploads chunks of code in AWS Lambda, and those code chunks perform some specific tasks. Behind the scenes, AWS Lambda will automatically provision the correct computing resources necessary to run the code. These resources include CPU and memory, as well as scaling and load balancing. This way, the user is freed up from managing the infrastructure and can concentrate on the functionality of the app.
The ideal method to copy logs from Amazon CloudWatch to Loggly would be using some sort of automated AWS Lambda function. Again, AWS Lambda is not tied to specific networks or instances, and like Amazon CloudWatch, it’s a standalone product.
There are already a number of AWS Lambda functions available in GitHub for sending information from AWS to Loggly. These functions can be used for:
- Sending Amazon S3 logs to Loggly
- Sending Amazon ELB logs to Loggly
- Sending Amazon CloudFront logs to Loggly
- Sending Amazon CloudWatch logs to Loggly
The AWS Lambda code to send Amazon CloudWatch logs to Loggly was originally hosted in GitHub and is still available there. It’s also been integrated into AWS Lambda console as a blueprint. With the new Loggly blueprint, everything is shrink-wrapped and much easier to set up: Users can access its functionality directly from the console.
(If you are wondering what a blueprint is, we will talk about it shortly. For now, just know that the purpose of this blueprint is to create an AWS Lambda function that will send Amazon CloudWatch logs to Loggly. Behind the scenes, the Loggly blueprint makes use of the same Node.js code that’s available in GitHub.)
Some Important Concepts of AWS Lambda
We will now go through some high-level concepts of AWS Lambda. Feel free to skip this section if you are already familiar with the concepts. If you need more in-depth coverage or want to start with the basics, refer to the official AWS Lambda documentation.
Invoking AWS Lambda Code
The code uploaded in AWS Lambda can’t do much unless it’s actually run. Running the code can be done in a number of ways, and in AWS Lambda terms, this is known as invoking the code:
- When certain events occur: This is the most common form of invoking AWS Lambda code. You can think of an event as “when something happens to a particular resource.” A few classic examples include when an object is placed in an S3 bucket or a record is added to a DynamoDB table. There can be other events too. For example, when log entries are added to a CloudWatch log stream or AWS CloudTrail records an API action, they all generate events.
Regardless of the event’s type, sometimes actions are necessary when the event happens, and AWS Lambda code is a perfect way to automate those actions. - When called manually: AWS Lambda code can be manually invoked over HTTPS. This involves creating your own REST API and mapping API methods like GET or PUT to specific AWS Lambda functions. Calling the API would then invoke one or more functions. We will talk about AWS Lambda functions shortly.
- As scheduled tasks: AWS Lambda code can be scheduled to run at certain times, in specific intervals. This is more like a cron job calling a shell script.
The AWS Lambda code generated by the Loggly blueprint uses the event-based model. In this case the event occurs when a new log is added to Amazon CloudWatch.
Event Mapping
So how does AWS keep track of events and the code it’s supposed to run? How does it know what chunk of code (also known as functions) to call when an event happens for a particular resource?
That’s done through something called Resource Mapping. With resource mapping, AWS keeps a list of events and maps them to existing AWS Lambda code blocks or functions. Where this mapping is created depends on how the event is sent to AWS Lambda. In a “push” model, the AWS resource will publish the event to AWS Lambda and directly invoke the code. In a “pull” model, AWS Lambda continuously polls the AWS resource and invokes the function itself when an event happens. For push events, the mapping is created in the resource itself. For pull events, AWS Lambda creates and manages the mapping.
Security and Permissions
There is a built-in layer of security with AWS Lambda. This security comes in two forms:
- An event source needs to have enough permission to invoke its AWS Lambda function. Invoking and executing are not the same thing. Regardless of how the event reached AWS Lambda – push or pull – the code has to be invoked first and then AWS Lambda will actually execute it. The AWS service therefore needs to have permission to access the code.
- When AWS Lambda executes the block of code, it may need to access other AWS services and resources. This access also needs permissions. The necessary permissions are listed in an IAM role, and when creating an AWS Lambda function, this role is assigned to it. When AWS Lambda starts running the code, it assumes the role’s privileges. This permission set is called the execution role for the function.
Later, we will create an IAM role when using the Loggly AWS Lambda blueprint. This role will have sufficient privilege for accessing the Amazon CloudWatch logs.
Writing Lambda Functions vs. Using Blueprints
AWS Lambda expects and accepts blocks of code written in any of the following three languages:
- Node.js
- Java 8
- Python 2.7
When coding in the three accepted languages, there are two ways to upload the code in AWS Lambda console:
- Writing directly inside a code editor in the console and specifying additional parameters
- Uploading code scripts and their dependencies in a zipped file and specifying additional parameters
As the code is uploaded, it’s verified and then installed in AWS Lambda. It then becomes what’s known as an AWS Lambda function.
There’s another method of creating AWS Lambda functions, and that’s through something called a blueprint. Basically blueprints are pre-packaged templates for common use cases that come pre-installed with the AWS Lambda console. A blueprint is like a wizard in the sense that it provides a nice wrapper for the manual process. Blueprints can be very simple like a “Hello World” application or more complex with specific functionality built in. With blueprints, the user needs to provide relevant details for the application and AWS Lambda creates the function automatically. You can also customize the generated settings to suit the application’s needs. Also, with a blueprint, you can safely test the functionality without affecting other parts of your application; this is the same if you created the function manually from scratch. Some blueprints provide sample events for this purpose. You can emulate those events from the AWS Lambda console and see how the function works.
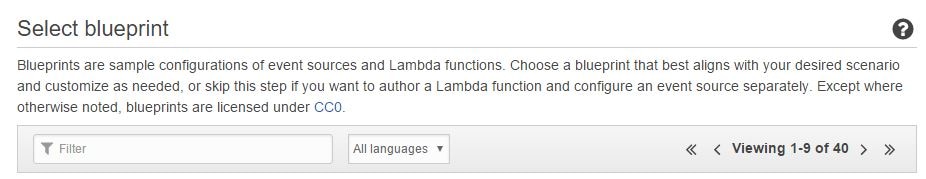
If you go to the AWS Lambda console, you will see some of the blueprints have been provided by Amazon, while others have been created by third-party vendors like Loggly. Unless otherwise noted, blueprints are provided free of charge, under a Creative Commons license. In the image below, you can see some of the AWS Lambda blueprints written in Node.js:
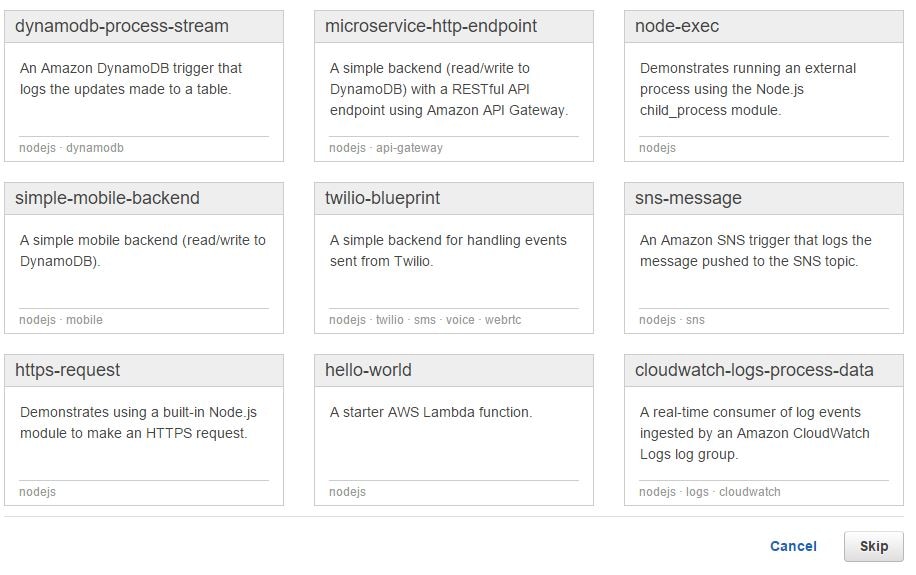
The AWS Lambda blueprint from Loggly is also written in Node.js. It can be used to generate a function that can send Amazon CloudWatch logs to Loggly. With this setup, the data flow is something like this:
- An application receives an event or performs some operation in response to user input.
- The application records the event in its log file.
- CloudWatch log agent running in the server sends the log event to CloudWatch logs.
- CloudWatch generates its own event when the log entry is added to its log stream.
- The event invokes an AWS Lambda function created with the Loggly blueprint.
- The AWS Lambda function copies the log data from Amazon CloudWatch to Loggly.
The purpose of a blueprint is therefore to create an AWS Lambda function that will do the actual processing.
The Test Application
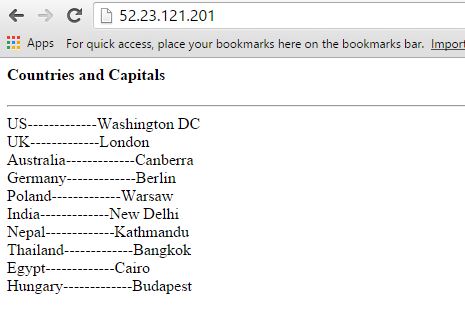
To test the AWS Lambda blueprint, we created a very simple web application in AWS.
The application runs PHP code hosted on an Nginx web server. The web tier is separate from the backend tier, which is running a PostgreSQL database. The web page queries data from a single table in the Postgres database and displays it to the user. A screenshot of the application showing a few countries and their capital cities is shown below:
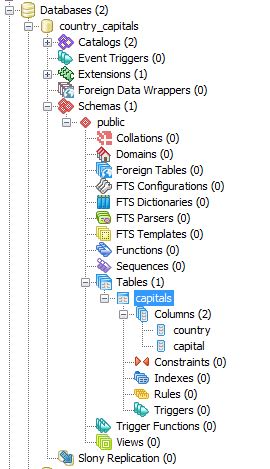
The database has a single table called capitals as shown below:
We have also configured our PostgreSQL Server to write its logs to a local log file, postgresql.log:
log_directory = 'pg_log'
log_filename = 'postgresql.log'
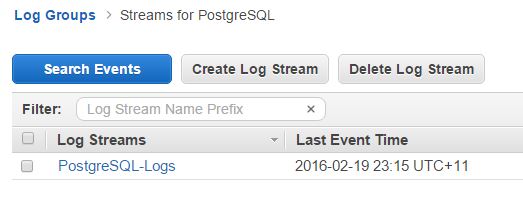
The Amazon EC2 instance hosting the Postgres server has an Amazon CloudWatch logs agent running in it. The agent copies logs from the Postgres log file and uploads them to Amazon CloudWatch logs. The following lines are from the awslogs.conf file for the Amazon CloudWatch logs agent:
[/var/lib/pgsql/9.4/data/pg_log]
datetime_format = %d/%b/%Y:%H:%M:%S
file = /var/lib/pgsql/9.4/data/pg_log/postgresql.log
buffer_duration = 5000
log_stream_name = PostgreSQL-Logs
initial_position = start_of_file
log_group_name = PostgreSQL
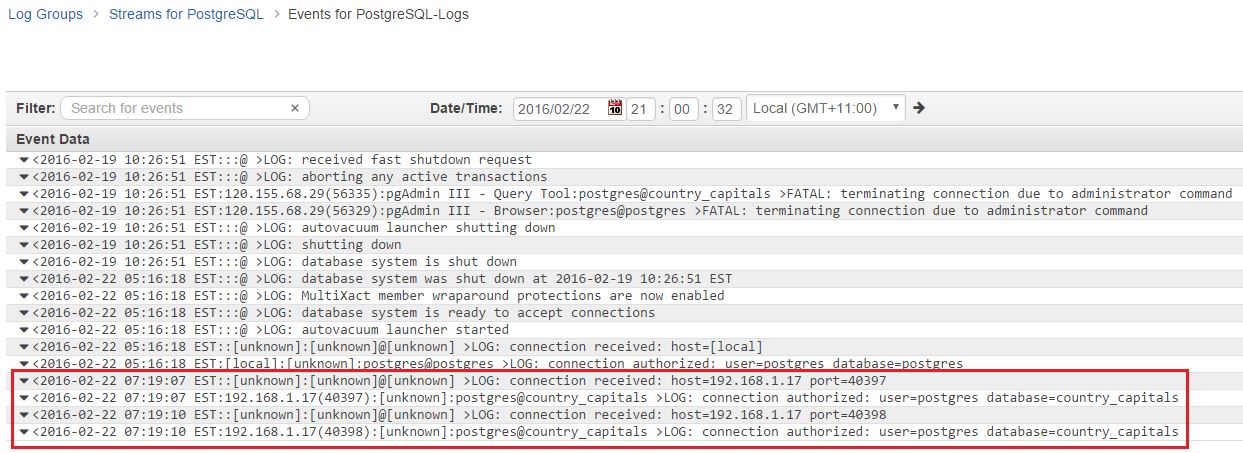
The image below shows the Postgres logs in Amazon CloudWatch:
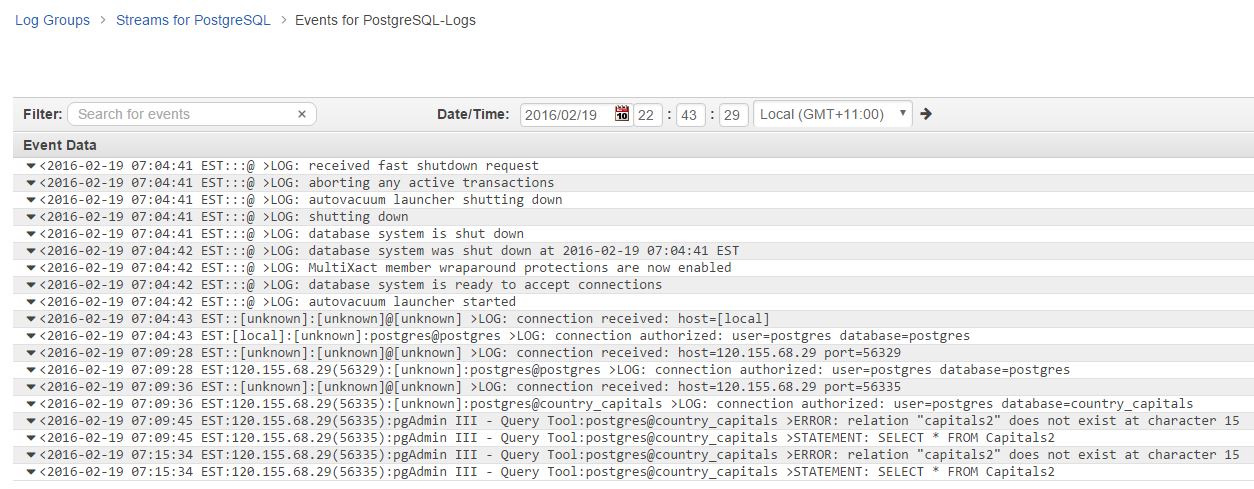
As you can see, the Amazon CloudWatch logs interface is fairly basic. And that’s how it’s supposed to be. After all, the intention here is to provide a central location for logs from all AWS-hosted resources, not to run detailed analytical reports. You can create metrics to search for specific texts within these logs and you can also set up alarms based on those metrics. You can’t, however, isolate and drill down through specific fields in a log entry. You need something like Loggly for such functionality.
Creating the AWS Lambda Function from the Loggly Blueprint
Before starting with the Loggly blueprint, a few things need to be set up:
- We will need to create an IAM role with appropriate rights to read from and write to Amazon CloudWatch logs. The Lambda function will assume this role at run time.
- We will need to create an encryption key in the AWS Key Management Service (KMS) and use that to encrypt the Loggly customer token.
- We will need to install the AWS CLI (Command Line Interface) tool in our local workstation and configure that for an IAM user with sufficient rights to AWS services. We can use the same user account that’s used to log into the AWS console.
Creating the IAM Role
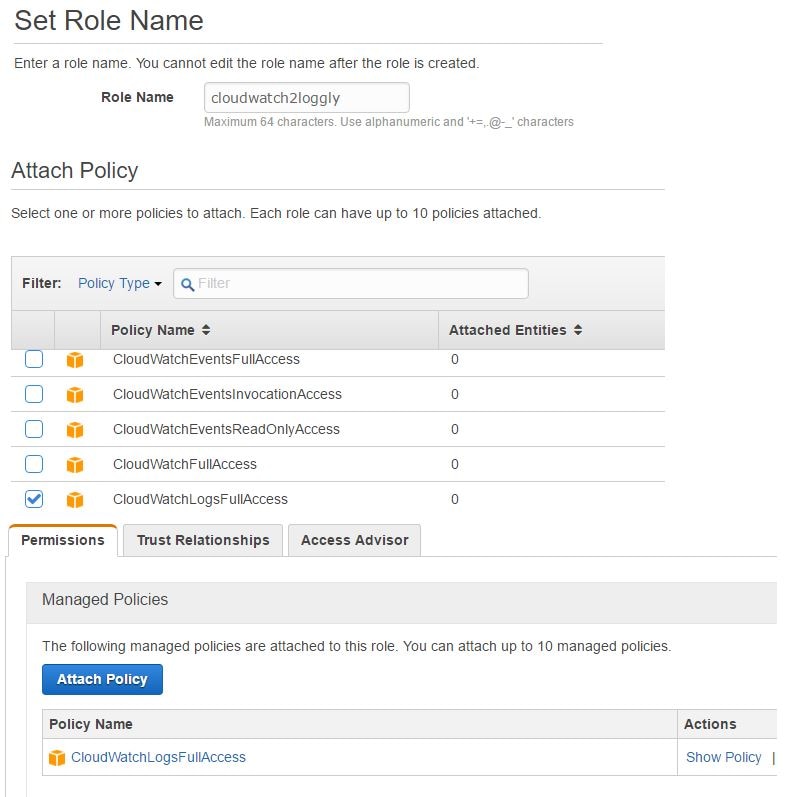
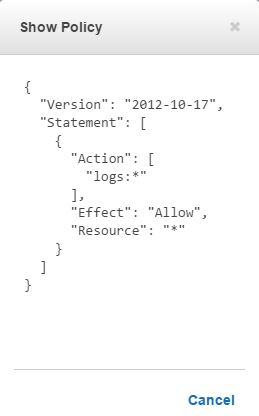
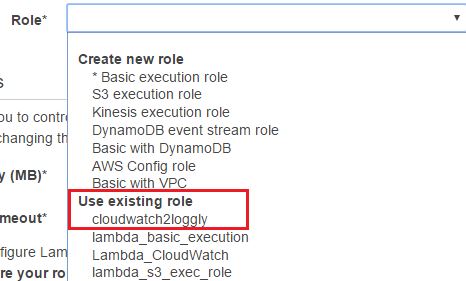
In the image below, we have created a new IAM role called cloudwatch2loggly. For the purpose of demonstration and simplicity, we have provided this role all access to Amazon CloudWatch logs. In real-life production environments, you would want more fine-grained control though.
Creating the Encryption Key
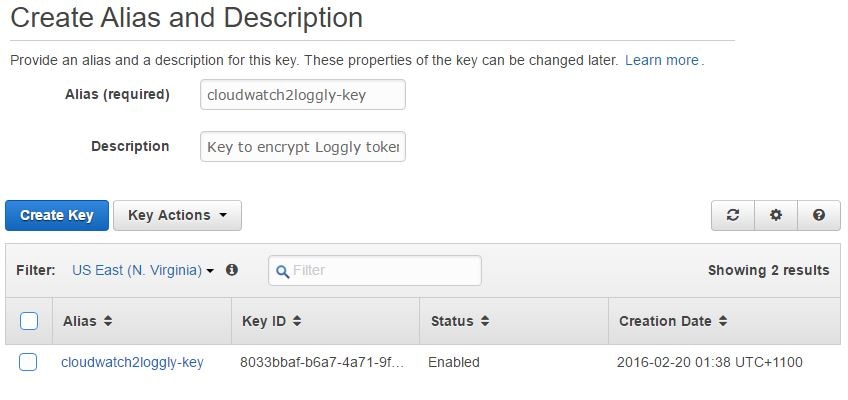
The next step would be to create an encryption key in the AWS Key Management Service (KMS). We won’t go into the details of KMS as the AWS documentation provides an excellent introduction to it. In short, KMS is a managed AWS service that allows you to generate encryption keys, which in turn can be used to encrypt user provided data. The key can be configured to rotate periodically.
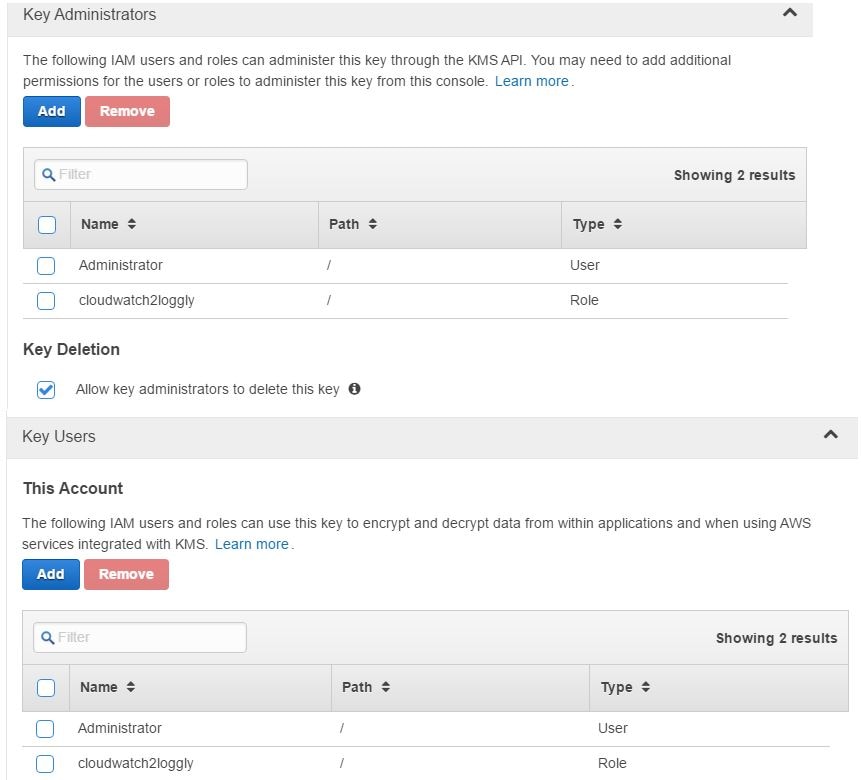
In the image shown below, we are creating such a key. This key will be used to encrypt the Loggly user’s customer token. You can find your account’s customer token from Source Setup > Customer Tokens page in Loggly. We have also ensured that the IAM account running the encryption process has appropriate permissions on the key. The same permissions have been set for the cloudwatch2loggly role as well.
If we look at the key’s properties, we will also find its ARN (Amazon Resource Name):
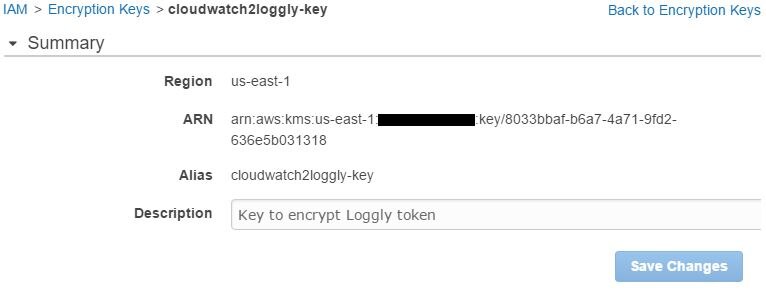
This ARN will be used in the next step, so we will need to copy it somewhere.
Encrypting the Loggly Customer Token
As a final step, we have to run the AWS CLI command for KMS to encrypt the Loggly customer token. The ARN of the key is used for this purpose. The syntax of the command is like this:
aws kms encrypt --key-id <kms key arn> --plaintext "loggly token"
The output will be in JSON format:
{
     "KeyId": "arn:aws:kms:<aws region>:xxxxxxxxxxxx:key/<long alphanumeric string>",
     "CiphertextBlob": "<very long alphanumeric string>"
}
In the output, the value of the CiphertextBlob item is the encrypted, base-64 encoded value for our Loggly token. We need to copy it somewhere as well.
Creating the AWS Lambda Function
With the preparation out of the way, we can start using the Loggly blueprint from the AWS Lambda console.
First, we have to click the Loggly blueprint from the “Select blueprint” screen. If it’s not listed on the first screen, you may have to search for it by name or language (Node.js) or navigate to the next screen.
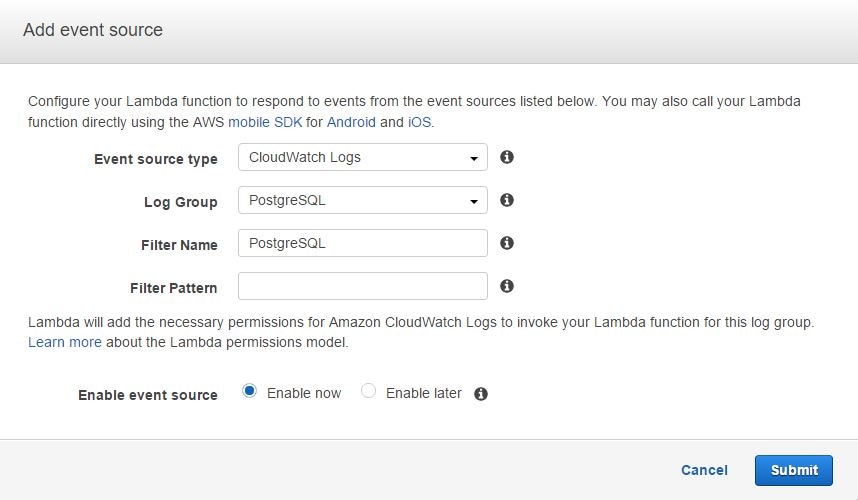
Once started, we will be taken to the next screen where we have to select an event source for the AWS Lambda function.
Remember our discussion about event mapping in the AWS Lambda concepts section: AWS Lambda needs to know what event will invoke this function. In this particular case, the event comes from Amazon CloudWatch logs, so the function needs to subscribe to Amazon CloudWatch Logs event.
We also have to choose a log group name and provide a name for the filter (this can be anything). We can leave the Filter Pattern field empty for this exercise. In the image below, we are choosing an existing log group called PostgreSQL. As mentioned before, this log group has already been created in Amazon CloudWatch and hosts our Postgres logs. We are choosing this log group because we want AWS Lambda to copy only PostgreSQL events to Loggly.
From this dialog box, clicking Next will take us to the main interface of the blueprint.
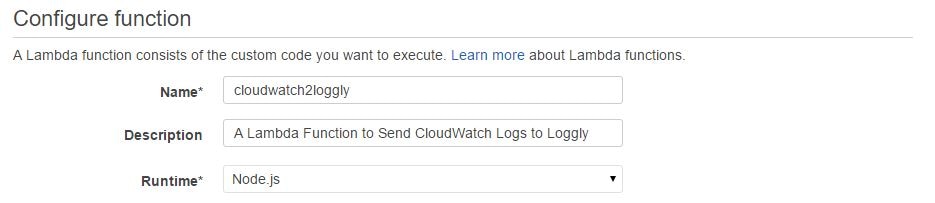
In the next screen, we need to provide a name and description for the AWS Lambda function. The code runtime will be automatically chosen as Node.js:
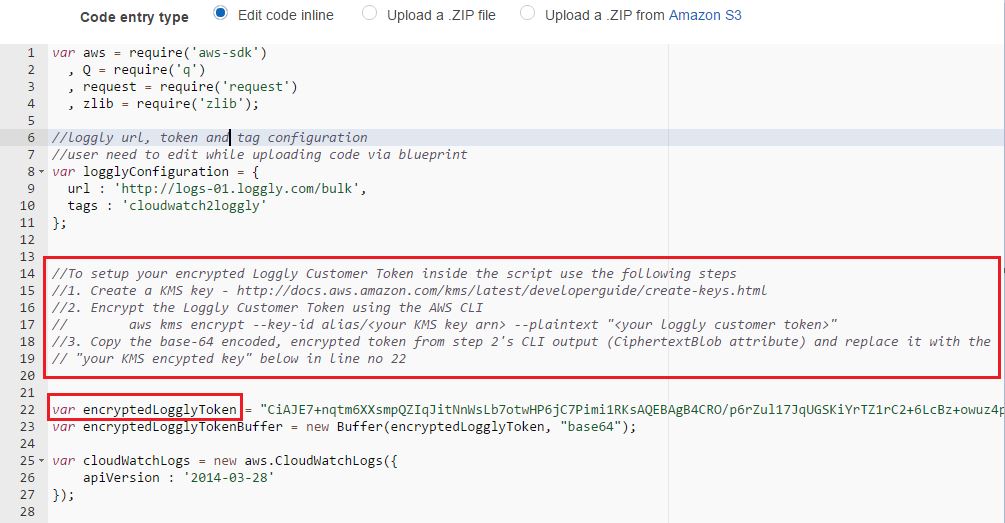
The next field (Lambda function code), will show the code entry type as “Edit code inline” and the text box under it will be automatically filled in with the Node.js code. We don’t have to type anything here except changing the Loggly customer token field with our encrypted value. This is highlighted in the image below.
If we were manually configuring the AWS Lambda function instead of using the blueprint, we would have the option of:
- Writing our code in the text box, or
- Uploading it from a zipped file
We could use either of these methods if we were using the GitHub-hosted code. You can follow the instructions in AWS documentation for creating an AWS Lambda deployment package to see how to create a zipped archive for a code script.
Once we have changed the default value for the Loggly token, we need to specify the handler function in the next field.
You might be wondering what a handler function is. Here is a little primer on it.
When coding in Node.js, each AWS Lambda function will have a block of code known as the handler. A handler is the main subroutine within the code block that responds to an event passed to the AWS Lambda function and performs some sort of action. This event happens when the AWS Lambda function is invoked by some type of trigger, like a new log entry being added to the Amazon CloudWatch logs.
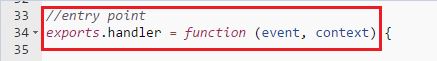
If you look further down in the Lambda function code text box, you will see the handler function has been defined in the generated code:
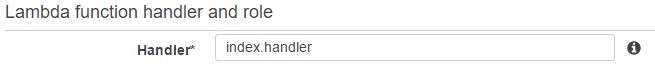
By default, AWS Lambda expects the handler name in the format <script_name>.handler. For most blueprints, this field is automatically populated with the value index.handler and we can safely leave this value here as well.
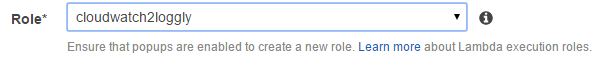
Next, from the Role field, we have to choose the IAM role we created before. This is the role the AWS Lambda function will assume at run time. In other words, the function will have the same permissions set into the role. The drop-down list in the image below shows cloudwatch2loggly role, which is selected:
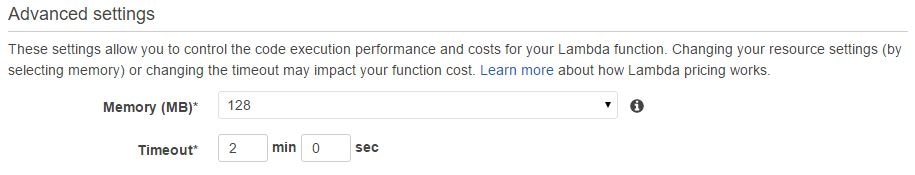
The next two fields let us specify how much RAM we would like to allocate for our code to run and how long Lambda will execute this function before timing out. The default is 128MB and three seconds, respectively. To be on the safe side, we have allocated two minutes as a timeout value.
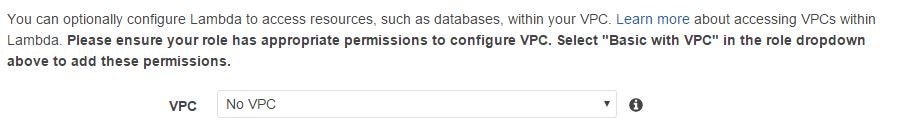
Finally, leave the default value of “No VPC” in the last field. We are not accessing any resources like EC2 or RDS instances as part of the AWS Lambda code, so this field can be left as it is:
Clicking the Next button will take us to a screen where we can review the options chosen and then create the function.
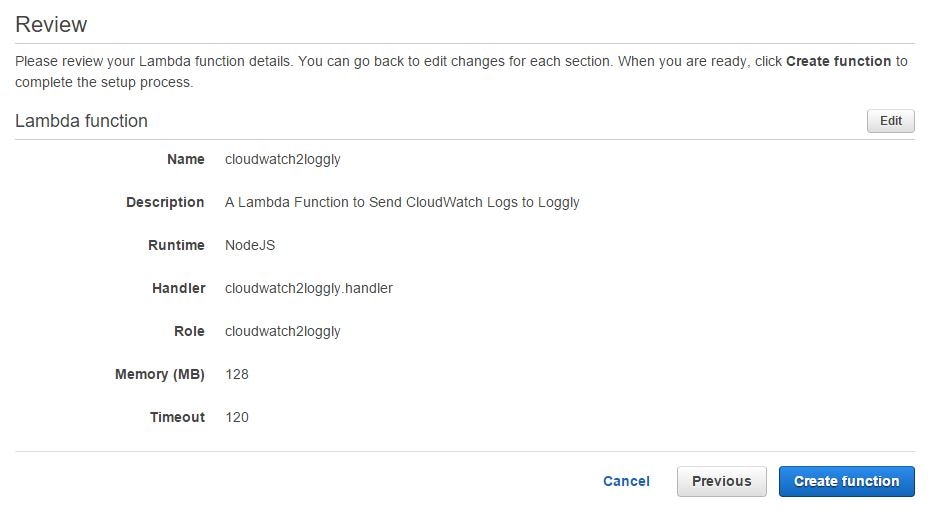
Once the function is created, it will be visible in the AWS Lambda console.
Testing the AWS Lambda Function
Now we have the AWS Lambda function up and running, how do we know it’s working?
To test the functionality, we can go back to the web application and refresh the page a few times. Each refresh would make the PHP application access the database, and with each database access, PostgreSQL would log the event. From there, it would be sent to Amazon CloudWatch logs and the AWS Lambda function would send the event to Loggly.
Going back to the Amazon CloudWatch Logs console, if we look at the log stream under the PostgreSQL log group, we will find the freshly added events.
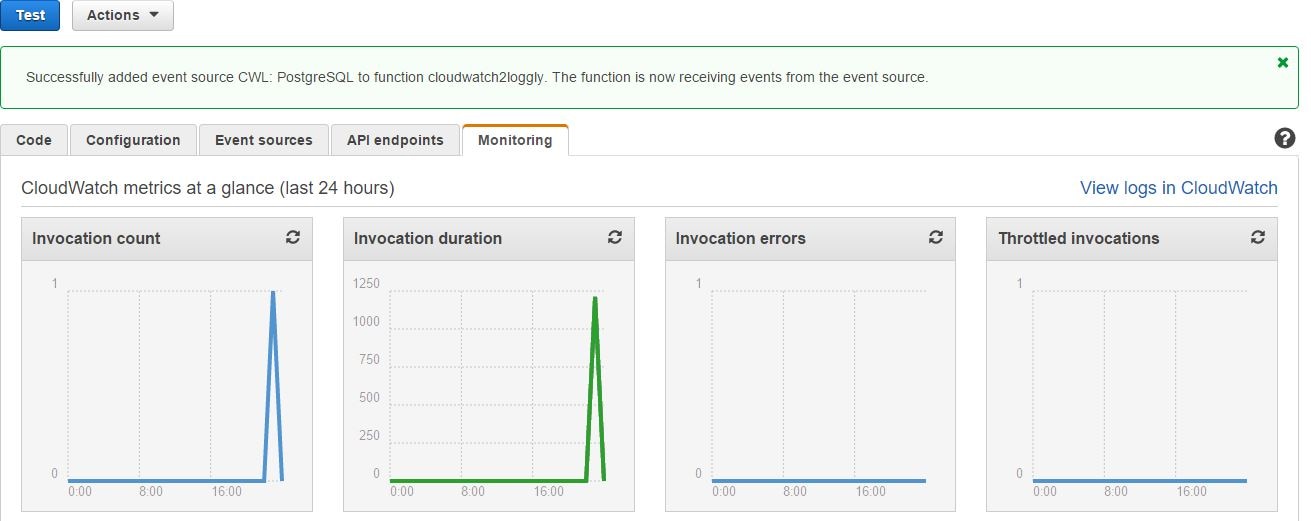
The Monitoring tab of the AWS Lambda function screen will show us the function’s invocation status. If everything is okay, we can see the graphs for invocation count and invocation duration.There will be no invocation errors:
View from Loggly
If we check from the Loggly console, we can easily find the PostgreSQL events:
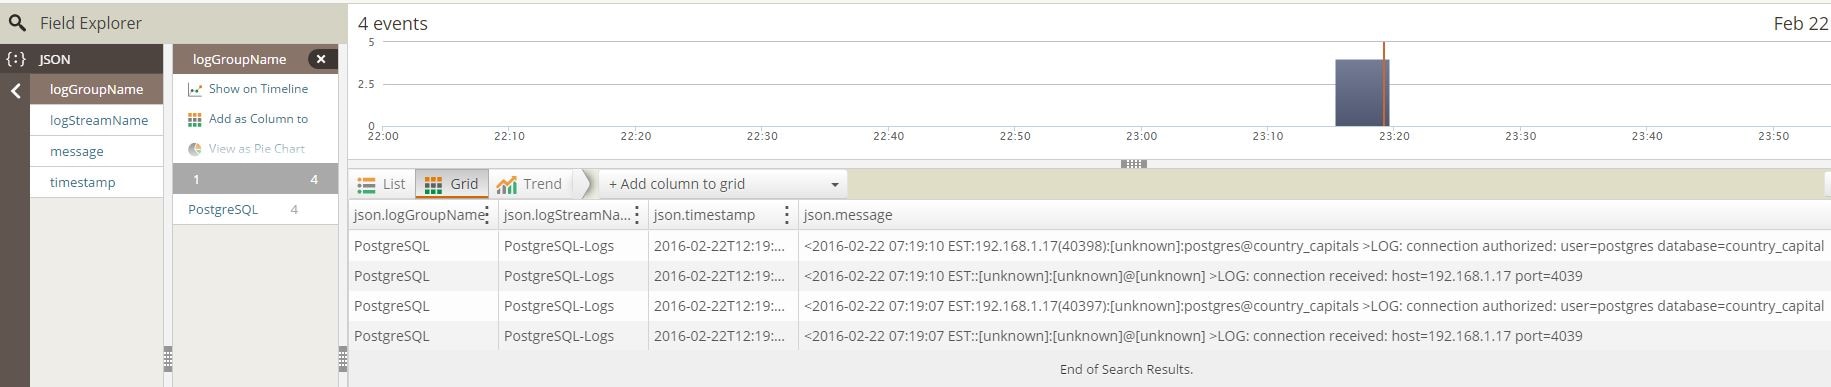
As you can see, the Postgres log events are fairly simple, with no errors reported.
Now imagine this situation. We have run an application upgrade that accidentally wiped off the database table or changed its structure and the queries don’t work anymore. This was perhaps done without proper planning from the development or operations team, and now we have a broken application:
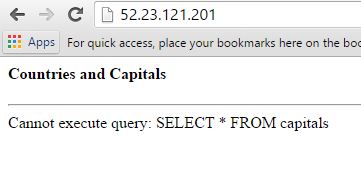
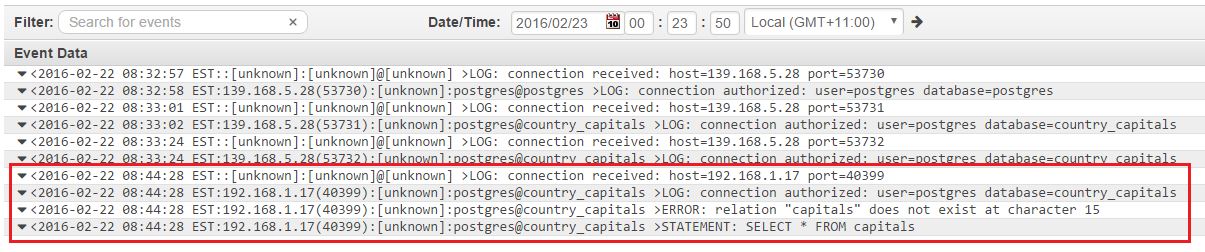
If we look at the Amazon CloudWatch logs, we can see the error immediately:
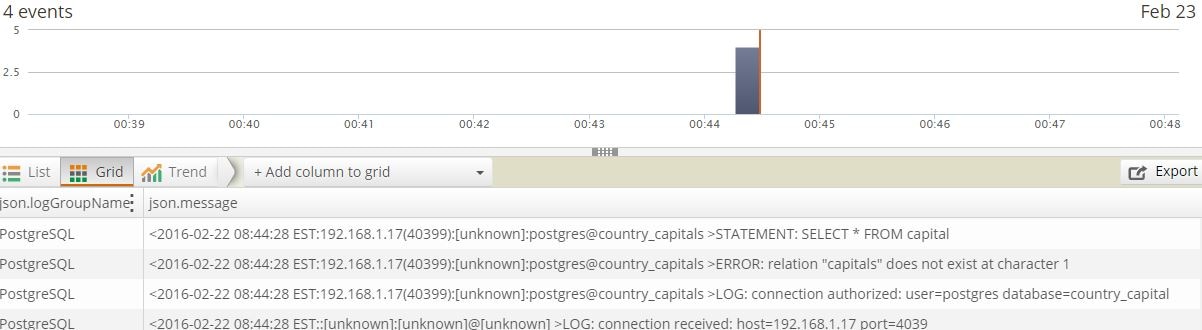
And this is picked up by Loggly as well:
This is a simple example, but think about a busy system with hundreds or perhaps thousands of hits per minute and other applications accessing the same instance. Every query is logged, and it would be a nightmare to find the time when this error started to happen.
With Loggly, we can run a feature called the Anomaly Detection. With Anomaly Detection, you can plot a trend graph from the existing log events in Loggly. You can then choose a field in the log message to see any deviation from its normal value over a period of time. When using this feature, Loggly plots the expected count of normal values against the actual count of values for a chosen field over a time period of time.
In this case, Anomaly Detection would show the number of errors increasing for the current time period, and from the analysis we would immediately know there is a problem in the application stack.
Final Words
Throughout this post we have talked about how the AWS Lambda blueprint from Loggly can help integrate Amazon CloudWatch logs with Loggly. But why would you use Loggly in the first place in addition to Amazon CloudWatch?
To answer that, we have to understand that Loggly is a dedicated log management solution. It’s true that Amazon CloudWatch logs gives us some great features like searching with metric filters and creating graphs and dashboards. But the sole purpose of Loggly is to make sense of the humongous volumes of log data ingested from your applications and servers. To meet that demand, Loggly offers some facilities not found in CloudWatch. Here is a brief comparison:
- Easy search: With Amazon CloudWatch logs, searching is done on date and time range and simple filtering of values. Loggly not only allows you to narrow down on date and time, it enables you to drill down in the logged event records formatted as JSON documents. Using a feature called Loggly Dynamic Field ExplorerTM, you can filter for specific types of records or fields with a particular value. In the image below, we are narrowing down our search for the PostgreSQL log group only:
- Saved Searches: With Loggly, once you build your search criteria, you can save it for later reuse.That’s something similar to Amazon CloudWatch Log’s Metric Filter, but more powerful, because you can add multiple filtering criteria.
- Alert Integration: It’s possible to create alerts from logged events in both Amazon CloudWatch and Loggly. However, Loggly offers alert integration with other tools like HipChat or Slack. That’s not possible with Amazon CloudWatch.
- Live Tail: In AWS, there’s a time gap between the actual events happening at the source and the logs becoming visible in Amazon CloudWatch. In Loggly, it’s possible to use a feature called Live Tail where the logs being sent to Loggly are continuously shown in a console in near real time.
- Automated Parsing: Amazon CloudWatch acts as a passive recipient for centralizing logs: it has no way of differentiating between logs coming from different sources like syslog servers, IIS, Nginx, or Java. As a result, there is no Amazon CloudWatch option for automatic parsing and analyzing of logged events. This is an inherent strength of Loggly. Automatic parsing allows Loggly users to run advanced statistical analysis on logged data.
There are many useful features in Loggly, but we can’t cover them all here. With a free tier available for starters, AWS cloud engineers and architects should take it for a test drive.
The Loggly and SolarWinds trademarks, service marks, and logos are the exclusive property of SolarWinds Worldwide, LLC or its affiliates. All other trademarks are the property of their respective owners.

Sadequl Hussain