Container Observability
Fundamental to Cloud Observability
In the recent past, container-based deployment architectures have played a significant role in improving applications on multiple fronts, including:
- Portability
- Operational resilience
- Scalability
- Availability
Containers are all-inclusive packages containing lightweight services which are easy to spawn and terminate.
However, container-based deployments can comprise hundreds of individual services and their replicas spinning up and down at any moment. As a result, this architecture poses challenges for logging and monitoring, making container observability a critical element of overall cloud observability.
In this article, we’ll consider why container observability is fundamental to cloud observability. We’ll also learn what cloud observability is, its importance, and how to implement it.
Understanding Cloud Observability
Observability is the concept of transparent IT systems emitting outputs to expose their internal system state and the sequence of events leading to this state. Logs, metrics, and traces are forms of telemetry data and are the most important elements of an observable system. The term “observability” has garnered widespread attention recently, particularly because of the increasing adoption of cloud-native architecture.
Cloud-native architecture is designed for the unique capabilities offered by cloud environments as opposed to traditional server-based deployments. The cloud environment provides unique possibilities for horizontal scaling, distributed processes, and—most importantly—automating processes for resiliency. A cloud-native approach uses the concept of software being run by software instead of people.
Though there are multiple ways to architect a cloud-native deployment solution, more recently, containers and Kubernetes have evolved as highly popular cloud-native deployments.
Organizations now use a combination of public cloud offerings and private cloud setups to guard themselves against resilience issues. This results in hundreds of containers running in clusters
across multiple cloud environments. It’s not feasible to SSH into containers to check logs as you would with traditional architecture. The short-lived nature of containers demands a new approach to monitoring and debugging applications.
All these challenges set the stage for centralized logging and cloud observability.
Benefits of Cloud Observability
Integrating observability concepts like centralized logging brings many benefits to the application architecture. One of the main benefits is increased reliability. This is because centralized logging helps with the generation of alerts based on set conditions. At times, these alerts can be raised before an adverse event has happened. Without centralized logging, this would be difficult to implement in a cluster-based deployment of containers.
Another key benefit of cloud observability is the improvement in incident management. Logs can provide full details about the system state, thereby improving the mean time to detect (MTTD) incidents. Traces offer details on the whole sequence of events, including service interactions, nested service calls, and database queries. Metrics help provide an aggregated view of the system through relevant numbers, helping to reduce the mean time to restore (MTTR).

Telemetry data also opens up avenues for automation, improving DevOps processes and operational efficiency. It also sets the stage for artificial intelligence for IT operations (AIOps), which leverages automated monitoring and historical data-based training to identify events before they occur.
Implementing observability concepts improves scaling strategies for DevOps teams. They can use telemetry data to define their scaling strategy and perform capacity planning.
Cloud observability offers several benefits to the health, reliability, and maintenance of application architecture. Yet, container observability is a fundamental aspect of achieving cloud observability.
Why Is Container Observability Important?
Containers are the foundational block of cloud-native application architecture. A container orchestration system can spawn or terminate containers based on external and internal factors. Naturally, to improve cloud observability, you need effective container observability.
A crucial part of container observability is identifying the scenarios leading to container termination. Conventionally, containers are stateless and ephemeral. A sudden container termination also means the loss of any useful evidence stored in its logs.
There are two leading reasons for most container failures:
- Errors in the application logic, resulting in high memory usage, exceptions, or other issues.
- Container-specific errors related to external factors (possibly including the host OS killing containers due to insufficient memory, permission issues, exhausting connections to a database, or other reasons).
In both cases, the exit code alone is seldom sufficient for engineers to understand the cause of failure. You need a detailed sequence of events to understand and fix the root cause. In many cases, traditional logs are not enough to do this. Logical traces and metrics are needed to get the complete picture.
Also, keep in mind containers often share resources like memory and processing power, so the reason for your container going down may not be inside that specific container. There could also be external factors at play.
For all of these reasons, container observability is essential.
Implementing Container Observability
Implementing container observability involves strategically using telemetry data in your application code. You could do this by integrating a framework like OpenTelemetry (OTel) in the application code and implementing a logging architecture recommended by your container orchestration framework or cloud provider. Let’s look at how to accomplish this.
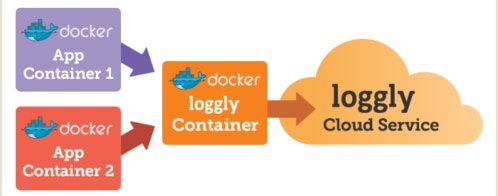
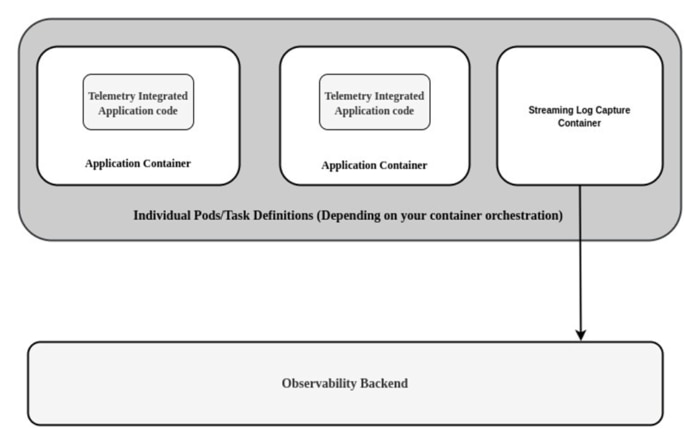
An observable container generally comprises the following components:
- A telemetry framework integrated into the application code.
- A log collection agent integrated as a sidecar container for shipping logs, metrics, and traces to an outside world.
- A backend to receive data from the observability agent and provide dashboard and alerting capabilities.
Tying together all the above concepts, the architecture typically looks like this:
The observability landscape has exploded in the recent past, and many tools and frameworks can help with implementing the above architecture.
ELK Stack
The ELK stack is a set of popular projects for implementing centralized logging architecture. The stack includes:
- Elasticsearch, which provides a searchable database
- Logstash as the logging agent
- Kibana as the logging backend
The advantage of the ELK stack is its generic nature, which you can customize for observability requirements. Elastic Observability builds on top of ELK to provide a unified view of logs, metrics, and traces.
Jaeger
Jaeger is an example of a monitoring tool you can use as a tracing backend. Jaeger is often the preferred tool in use cases where tracing is the priority. It uses a push-type mechanism and comes with a comprehensive web UI. Jaeger also has a pluggable storage backend feature, allowing one to use any scalable storage system for the indefinite storage of logs.
Prometheus
Another notable tool in this space is Prometheus. Since the primary use of Prometheus is capturing metrics, it’s popular among developers using metrics-heavy applications. Natively, Prometheus only scales vertically. It needs third-party services and complex setups to be performant at scale. Prometheus works based on a pull-type data ingestion mechanism. It supports PromQL, which helps in analyzing the metrics data.
Conclusion
For modern applications built on modular microservices and deployed in container clusters, cloud observability is a core necessity. Observable systems provide better operational resilience and quality input for scaling decisions. They also open up the path for AIOps.
Container observability is fundamental to achieving cloud observability since containers are foundational to any cloud-native architecture.
SolarWinds offers simple, powerful, and secure solutions for today’s cloud-native and hybrid IT realities. SolarWinds Observability SaaS goes beyond traditional monitoring and speeds up problem resolution through cross-domain analytics and actionable intelligence.
If you’re using a cloud native or hybrid cloud and looking for a partner to accelerate your journey in observability, check out SolarWinds.
The Loggly and SolarWinds trademarks, service marks, and logos are the exclusive property of SolarWinds Worldwide, LLC or its affiliates. All other trademarks are the property of their respective owners.

Loggly Team