Effective Log Management and Analysis as an Enabler for Observability
Traditionally, when monitoring or troubleshooting active incidents, engineers access logs directly on the source system. However, modern IT environments are now too complex, and engineers can no longer manage and analyze logs effectively this way. With the adoption of microservices and the use of cloud-native infrastructure, it’s no longer feasible.
Despite this shift in complexity, site reliability engineers (SREs) and DevOps teams still rely heavily on logs—not just for monitoring and troubleshooting but for observability. You can use logs for many forms of analysis, including the following:
- User behavior analysis
- Outage postmortems
- Anomaly detection
- Establishing baselines for evaluating the impacts of a change
In this article, we’ll cover what log management and log analysis are, the relationship between log management and observability, and how log management and analysis help enable observability.
Centralizing – Collecting logs from various source systems and sending them to a central location. This is often done using agents, API calls, or HTTP event collectors.
Parsing – Converting logs from multiple systems into a standardized format. This involves separating events, extracting key-value pairs, and sometimes adding tags to event types.
Searching – Using a query language to retrieve events based on search criteria. You can also filter results by a specific time period, host, or search term.
Storing – Using on-premises or cloud storage to compress and store data for a specific retention period. This can differ depending on the data source.
What Are Log Management and Log Analysis?
Log analysis involves extracting valuable information from log files to make more informed business decisions and improve processes. You can correlate data sources to add context, conduct historical analysis to make predictions, or filter results to zero in on an issue.
Log analysis often requires manipulating raw data to improve its usefulness. You can concatenate fields, join data sources, calculate results from two or more fields, or apply statistical functions to group events together.
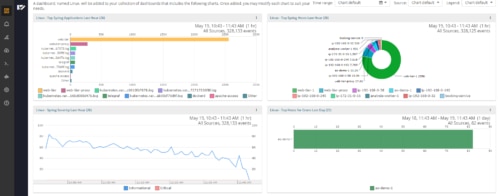
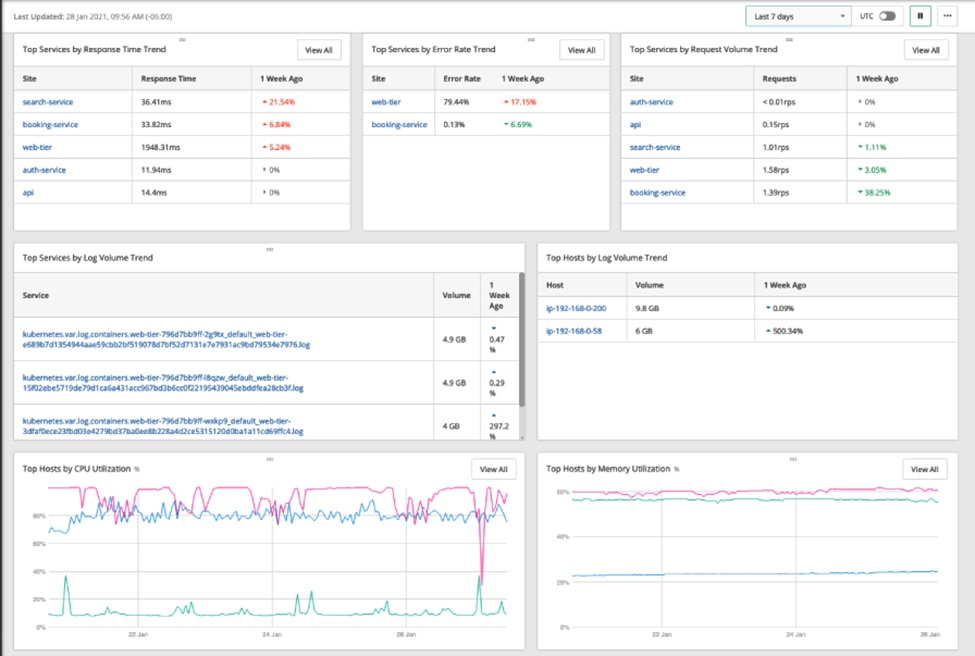
Intelligent log analysis powers dashboards, reports, and alerts, making it easier to spot anomalies and trends. For example, dashboard graphs can highlight sudden spikes, and color coding can help you immediately spot errors. Reports give a point-in-time snapshot and often summarize key fields to help track progress and stay compliant. Alerts trigger when specific criteria are met, so you can use this to identify when an issue has occurred and notify the right people to investigate or repair it.
The Relationship Between Observability and Log Management
Observability takes monitoring a step further by not only identifying what’s happened but answering the fundamental questions of how and why it happened and uncovering its effects. With observability, we can find and connect events in complex, distributed environments and trace them back to the root cause.
Three key elements of observability are logs, metrics, and traces.
- Logs are files or data streams designed to record contextual information about application and device events. They usually include fields like timestamp, hostname, source IP, and severity. A Windows Event Log or an Apache Web Server log are examples.
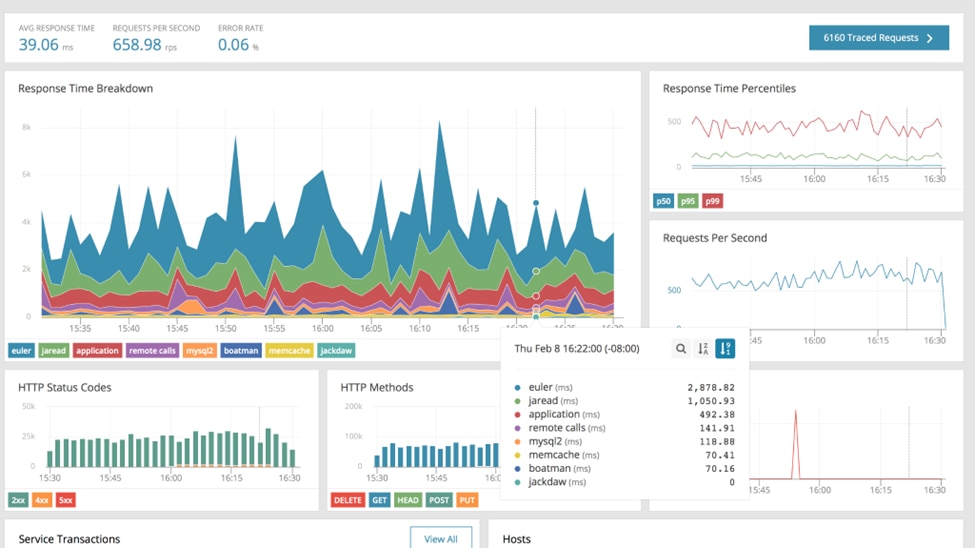
- Metrics are real-time measurements designed to report the health and performance of applications and infrastructure components. They usually contain small snippets of information, such as CPU levels, transactions per second, uptime, and downtime.
- Traces represent the journey of a request as it flows through different parts of the application layer. They have an identifier, such as a trace ID, to correlate events together. Traces are useful in complex applications leveraging microservices, giving you a holistic view of the request.
The Challenges of Log Management
Aligning log management processes for effective observability can be challenging.
One challenge is collecting data from different source systems. Devices and applications send logs in a variety of structured and unstructured formats. Effective and accurate parsing of all log types is a significant challenge. This can be especially difficult in environments with thousands of different systems.
Dealing with high log volumes presents another challenge. Some environments can send terabytes of data daily, so many companies struggle to find the hardware and budget to store and search through it all. Deciding on data retention policies can be difficult, as you must determine which data won’t be needed after it’s deleted.
Another challenge is translating raw data into useful information for the business. Log formats aren’t always well documented, so it’s sometimes difficult to know what each field represents or what normal versus abnormal behavior looks like.
How Log Management and Log Analysis Enable Observability
Log management solutions need to adapt continuously to keep up with the increasing complexity of modern application stacks. They should support the ingestion of all types of data—logs, metrics, and traces. They must also facilitate data correlation and integrations with other tools and applications.
Effective log management and analysis enable you to go beyond basic monitoring and achieve full observability in several ways.
Easier Root Cause Analysis
A good log management system will leverage artificial intelligence (AI)/machine learning (ML) to provide deeper analysis. Identifying patterns or correlations can help pinpoint the root cause of an issue and prevent it from recurring.
Better User Experience and Performance
By linking events and telemetry automatically, you can reduce troubleshooting time and fix issues faster. Developers and operators can quickly link errors or bugs to poor user experience, making changes to improve performance.
Improved Visibility
Centralizing logs from distributed systems is an integral part of effective log management. It removes the need to connect to individual hosts just to examine logs. Instead, a centralized log management system lets you view logs across your entire system in a single place through dashboard visualizations or reports. This improves security—as direct server access can be restricted—while still providing access to logs for analysis. Engineers will benefit from well-designed dashboards capable of clarifying which hosts or errors are important to look for.
Historical Analysis for Spotting Trends
Visualizations like graphs or heat maps make it easier to spot patterns, spikes, or dips. Understanding how your application or infrastructure behaves over time can help you implement changes to fine-tune its performance. For example, identifying peak usage periods can allow teams to configure environments with increased resources during those times.
Predictive Monitoring and Self-Healing
The incorporation of AI/ML into log management and observability solutions can help mitigate issues before they occur. For example, an ML algorithm might recognize a pattern in disk space usage and alert you before a server runs out of space. Connecting predictive monitoring with self-healing tools takes monitoring a step further by automating the response to an incident. Rather than just alerting on disk space and waiting for human intervention, self-healing tools can clear space or extend the drive.
Conclusion
Effective log management and analysis tools can help you take the leap from monitoring to full observability of your environment. Instead of treating each event and alert as a separate incident, you can correlate data, link events, and leverage AI/ML to discover why things are happening, what they relate to, and their wider impact.
The key to achieving full observability is having the right tools in place. You should use an observability tool that can accept all telemetry formats, makes correlation easy, provides a variety of visualizations, and integrates well with your tech stack.
The Loggly and SolarWinds trademarks, service marks, and logos are the exclusive property of SolarWinds Worldwide, LLC or its affiliates. All other trademarks are the property of their respective owners.

Loggly Team