Effective Logging in Node.js Microservices
Many modern software applications are built with a microservices architecture, and Node.js has become the runtime environment of choice for many developers building microservices. However, working with logs in microservices—especially as complex applications comprise dozens (or more) microservices—is a challenging and cumbersome endeavor.
Logging is a crucial part of building and maintaining an application. Logs offer insights into application behavior, help with debugging, and are integral to effective system monitoring.
When facing the challenge of logging in distributed microservice applications, the solution lies in using a dedicated logging library and a centralized log management system. This post will guide you through logging in a Node.js microservices setup. We’ll show how to get started with a logging library (no more relying on console.log!), manage and log exceptions, and ship your logs to a centralized logging platform like Loggly.
Whether you’re just starting with microservices, or looking to enhance your existing setup, this guide is for you. Let’s dive in!
Logging in Node.js
While console.log can be useful for simple applications or quick debugging tasks, its usefulness in microservices is limited. There is no functionality for directing logs to different destinations; everything goes straight to stdout. In a microservices setup, where you have multiple services each generating their own logs, this quickly becomes unmanageable.
The ability to redirect logs to different files or even external systems is crucial for effective log management in a microservices architecture. This is precisely where a dedicated logging library shines. Not only do these libraries allow for easy redirection of logs, but they also support features like log levels, formatting, and even integrating with external log management services.
A dedicated logging library helps you implement a scalable, manageable, and powerful logging system that is well-suited for the complexities of a microservices setup. Fortunately, Node.js developers have a wide range of robust logging libraries to choose from. Popular choices include:
- Winston: Offers multiple transport options, allowing logs to be directed and stored in diverse locations.
- Bunyan: Outputs logs in a JSON format and also comes with features such as log rotation and streams.
- Morgan: Designed specifically as an HTTP request logger middleware, often used with frameworks like Express.
- Pino: Known for being blazing fast, Pino is often the go-to choice when performance is a key concern.
For the purposes of this post, we’ve chosen to demonstrate logging with Winston.
Implementing logging in a Node.js microservice
To demonstrate logging in a Node.js microservice, let’s build a simple Express server. We’ll begin by initializing our project, using yarn as our package manager.
| ~/project$ yarn init |
Next, we’ll add our dependencies.
| ~/project$ yarn add express winston |
To set up our logger, we’ll create a new file called logger.js. We’ll configure our Winston logger with the following code:
// logger.jsconst logger = winston.createLogger({if (process.env.NODE_ENV !== 'production') { |
In this setup, Winston will write logs of level error to error.log. Winston will write all logs (including error level) to combined.log. In non-production environments, Winston will also output logs to the console.
Now, let’s create an Express application with two endpoints (GET and POST), and we’ll include logging statements. Our index.js file looks like this:
const express = require('express');app.get('/', (req, res) => {app.listen(3000, () => { |
In this application, whenever a GET or POST request is made to the root route (‘/’), an informational log will be created indicating the type of request received. When the server starts, it will also log that the server has started and on which port.
We start our application in a terminal window:
~/project$ node index.jsinfo: Server started on port 3000 {"application":"my-server"} |
In another window, we use curl to send some requests to our server:
~$ curl -X GET localhost:3000~$ curl -X POST localhost:3000. |
We notice that our project folder has a file called combined.log. Here are its contents:
{"application":"my-server","level":"info","message":"Server started on port 3000"} |
We also have an error.log file, but it’s currently empty (because there were no errors).
And just like that, we’ve implemented basic logging in our Node.js microservice using Winston!
This would be a good time to highlight some best practices when it comes to logging in Node.js microservices:
- Include log levels. Properly categorizing your logs with levels (such as info, warning, and error) can help you with filtering and analysis.
- Use structured logging. Using a structured format for your log messages—like JSON—will simplify processing and analysis, especially if you are aggregating logs across various microservices.
- Add correlation IDs. In a microservices architecture, a single transaction can traverse multiple services. By adding a correlation ID to a transaction and including it in your logs, you can trace a transaction as it winds through your entire system.
- Don’t log sensitive data. Passwords, personally identifiable information (PII), and other sensitive data should never be written to your logs.
Now that we’ve covered the basics of implementing logging in a Node.js microservice, let’s shift gears and look at another important concept: exception logging.
Exception logging
Exception logging involves capturing and recording the errors and exceptions that occur in your application during its execution. By logging these exceptions, you not only receive alerts when something goes wrong, but you can also get information that is useful for troubleshooting and fixing errors. This quickens issue remediation, reduces downtime, and improves the overall reliability of your application.
Commonly encountered exceptions and errors in Node.js applications include:
- Syntax errors occur when the Node.js interpreter encounters code it can’t parse.
- Reference errors occur when your code attempts to use a variable or function that does not exist.
- Type errors occur when an operation is performed on an incompatible data type (such as invoking a string as a function).
Let’s modify our Express application in index.js, adding in some code that will trigger some of these common errors, but let’s catch these exceptions and log them with Winston. Our updated index.js file looks like this:
const express = require('express');}); |
Then, we restart our application and send curl requests (GET, then POST). As a result, our combined.log file has these lines:
{"application":"my-server","level":"info","message":"Server started on port 3000"} |
Our error.log file looks like this:
{"application":"my-server","level":"error","message":"TypeError: myString is not a function"} |
By properly using try-catch blocks in our application, we are ensuring that we handle exceptions gracefully while logging information that will be helpful for debugging.
Aggregating logs in a microservices environment
We see the benefit of logging to a file instead of stdout, especially in the context of microservices. However, in an application with multiple microservices—with each generating a log file and possibly running in its own host or container—we end up with a constellation of dispersed and disparate log files. Investigating an issue will require accessing log files on each host and then stitching together information across these files. The approach is neither efficient nor scalable.
The solution to this challenge is centralized logging. With centralized logging, we collect and store logs from various sources—in this case, from multiple microservices—in a single, centralized log management system. This provides you with a unified view of all your logs in one place, making it easier to search, analyze, and correlate events across your microservices. This consolidated view will enhance your ability to identify patterns, spot anomalies, and diagnose issues more rapidly. Let’s look at how to achieve this in our Node.js application by configuring Winston to ship its logs to Loggly.
Integrating Node.js Microservices with Loggly
Loggly is a cloud-based log management service that lets you aggregate and analyze logs across your microservices. With powerful search, real-time analytics, and visualizations, Loggly makes it easy for teams to quickly identify and troubleshoot application problems.
When logging with Winston in your Node.js microservices, you can use the winston-loggly-bulk package to transport your logs to Loggly.
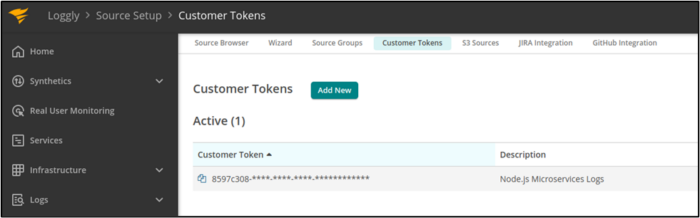
1. Get Loggly token
When we configure Winston to ship logs to Loggly, we will need a token from Loggly for authentication. From our Loggly account, we navigate to Source Setup ➢ Customer Tokens, and then we copy our token.
2. Add the winston-loggly-bulk package
~/project$ yarn add winston-loggly-bulk |
3. Modify logger configuration to use winston-loggly-bulk
Next, we’ll modify our logger.js file, setting up our logger to use winston-loggly-bulk for shipping application logs to Loggly. Our modified file looks like this:
// logger.js],if (process.env.NODE_ENV !== 'production') { |
We’ve added a new transport to our Winston logger, configured for Loggly. We copy over our Loggly token and the domain associated with our Loggly account (which is the initial part of the URL you see when logged into Loggly).
4. Restart application and send requests
With our new logger configuration in place, we restart our application (node index.js). Then, we send some curl requests to our application as we did above. In our demonstration, we sent some requests that threw exceptions. Then, we fixed the buggy code in index.js and sent additional requests which were successful.
5. Verify the arrival of logs at Loggly
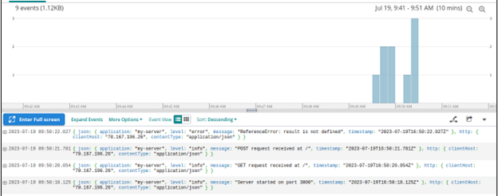
Finally, we refresh our Log Explorer at Loggly, adjusting the visualization window to look for logs that have arrived recently.
Our microservice logs are being sent successfully to Loggly!
Effective log management with Loggly
Let’s highlight briefly how we can make the most of Loggly for microservices logging.
Aggregate logs from every microservice
In our demonstration, we sent logs from a single microservice to Loggly. However, you can configure every microservice in your application to use Winston’s Loggly transport for sending its logs to Loggly. By adding appropriate tags (note how we used the tag 'my-app‘ in our logger.js file) to each microservice, you’ll be able to filter and search for the logs from a specific microservice, even though all of your logs are aggregated into a central location.
Filtering with the Field Explorer
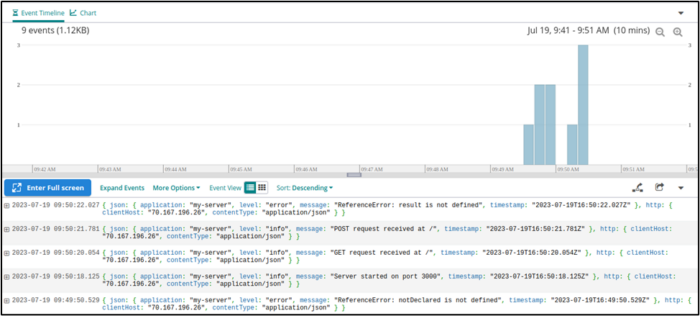
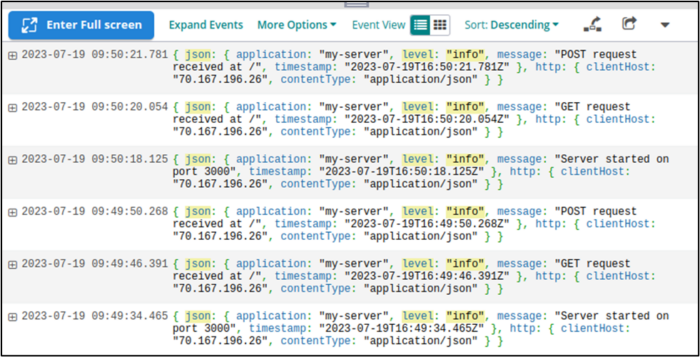
We can use the Field Explorer to filter log entries with specific values. For example, in our structured (JSON) logs, we can find all entries with level equal to info.
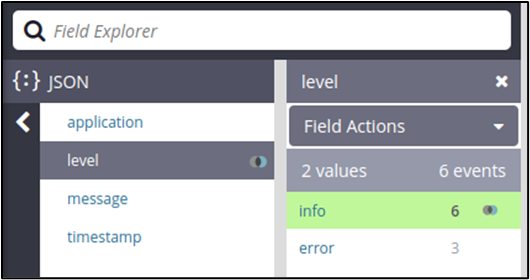
The resulting list looks like this:
Searching for specific criteria
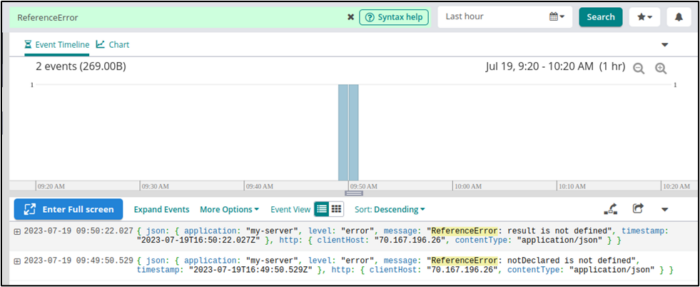
The search bar at the top of our Log Explorer lets us track down specific values in our log entries. For example, we can search for all entries that have the string ReferenceError in them.
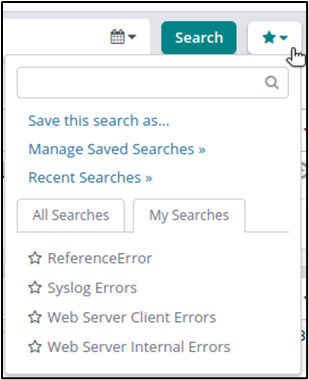
We can also save our searches for reuse or for configuring log alerts.
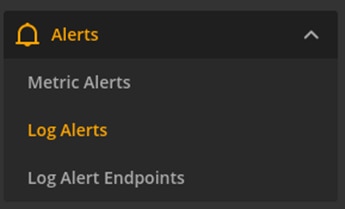
Log alerts
Log alerts are an excellent way to provide continuous monitoring of your microservice logs. We can set up alerts, telling Loggly to notify us whenever it receives logs that match certain criteria. To do this, we navigate to Alerts ➢ Log Alerts. Then, we add a new alert.
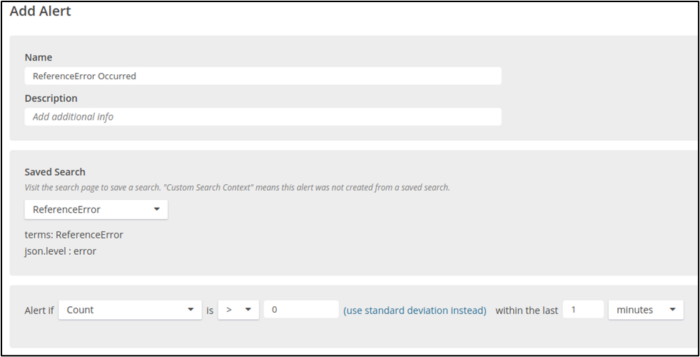
We configure our alert to use one of our saved searches. If that search yields results, then Loggly will send a notification based on the thresholds that we set. For example, the following configuration uses the ReferenceError search that we just saved, setting the threshold for notification to be any occurrence (Count > 0) within the last minute.
Loggly has a rich set of additional features, including statistical analysis, customizable dashboards, and derived log fields. We’ve only scratched the surface!
Conclusion
With microservices running in containers or hosts, console logging is no longer a viable option. For this, we need to take advantage of logging libraries. In a Node.js microservice, we might use libraries like Pino or Winston.
However, once we have an application on several distributed microservices, effective troubleshooting and analysis require that we aggregate logs to a centralized log management platform. In our Node.js microservice demonstration, we saw how easy it is to configure Winston with the winston-loggly-bulk package to ship our logs to Loggly.
With logs across all our application microservices, we can use Loggly for filtering, searching, visualization, and continuous monitoring. Microservice logs are no longer unwieldy or inaccessible. The convenience of centralized logging brings efficiency and effectiveness to incident troubleshooting, root cause analysis, and performance optimizations.
To start using Loggly for your distributed microservices and Node.js applications, sign up for a free trial today.
The Loggly and SolarWinds trademarks, service marks, and logos are the exclusive property of SolarWinds Worldwide, LLC or its affiliates. All other trademarks are the property of their respective owners.

Loggly Team