How to Implement Apdex Latency Measurement and Monitoring Using Loggly
The Loggly API gives you flexibility to search and gather data so that you can perform any calculation on the information retrieved using whatever language or tool you are most familiar with. In this blog post, we use a simple Python script to compute the apdex latency metric from log data sent to Loggly, so that you can either visualize it in Loggly as a dashboard, or use the information in any business intelligence system in use at your company.
In our example, we will use Loggly both as a source of data as well as a visualization platform for the results, but the process outlined here can be put in place with any BI platform.
In my previous posts, I discussed the advantages of the apdex metric as well as the limitations of simply using average values to monitor application performance. The apdex metric is defined as:
(Requests leaving users Satisfied + 50% of Requests Tolerated by Users ) / Total Requests)
We will decompose it into two relative metrics:
- Rs = % of requests leaving users satisfied
- Rt = % of requests tolerated by users
For a given threshold T, they are combined as follows:
- ApdexT = Rs + ½ Rt
First, let’s examine how to calculate relative metrics using the Loggly API.
Tracking Relative Metrics Through the Loggly API
Tracking relative metrics using the Loggly API is best done in three steps:
- Search: Craft the queries for the numerator and denominator and test it in the API using the fields option
- Automate: Create a script to fetch aggregate data via the Loggly API, create the calculation, and send results into your data repository, running it via cron with a set frequency
- Present: Visualize data with your favorite tool (including Loggly!) and drill down to the raw data
Search
We first perform our search on the Loggly website, then validate it with the API.
Suppose that, for a given application, you log response time in the field json.response_time_ms. Additionally, let us assume that, based on user feedback, you have selected a threshold T = 1000 ms.
First, log into the Loggly website to test the following queries:
| Numerator | json.response_time_ms:<1000 |
| Denominator | json.response_time_ms:* |
As implemented in the API, for a given Loggly <account>, each call would be:
| Numerator | https://<account>.loggly.com/apiv2/fields/json.response_time_ms?q=json.response_time_ms:<1000&from=-1d&until=now |
| Denominator | https://<account>.loggly.com/apiv2/fields/json.response_time_ms?q=*&from=-1d&until=now |
The response from the API could include useful statistical metrics in addition to counts, but we will ignore them for the purposes of our example. We are interested in the “total_events” key/value pair returned by the API.
Automate
To automate this, we need to calculate the ratio of the “total_events” for each call in order to compute metrics Rs and Rt. Then, we need to calculate the apdex metric, and finally send it to our data repository. In my example, the data repository is Loggly itself.
Here is the Python code to do this. It can be modified to send the apdex data to any data store.
Present
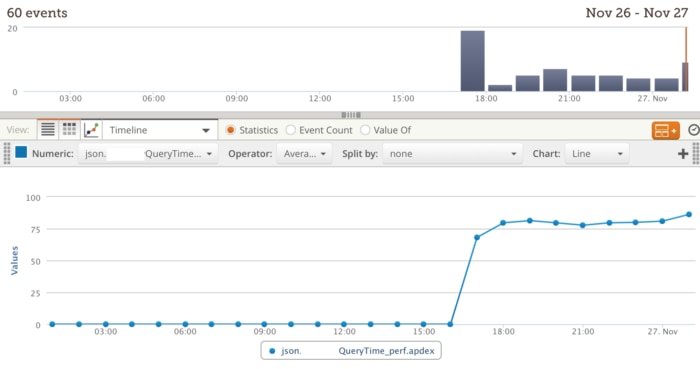
Once the aggregate data is in your data store, you can create a dashboard to display the results with the BI tool in use at your company. You might want to also send the metric back to Loggly, so that you can keep track of it at the operational level and also have the raw data to drill down when investigating exceptions, changes in trends, etc. Here is an example of how to create a Loggly dashboard with the apdex metric:

Setting up a dashboard in Loggly is quick and simple
Setting up a dashboard involves performing the query within the desired time window as shown above, pressing the ![]() button to save the widget, and inserting the widget into a new dashboard.
button to save the widget, and inserting the widget into a new dashboard.
Conclusion: Loggly Gives You Tools to Stay Ahead of Operational Issues
Relative metrics, which compare counts between two or more variables, are a simple yet very effective way to keep track of system or process performance. We have shown how to use them to create the apdex metric, by grabbing data via the Loggly API. Not only do they help DevOps to define baselines and yield evidence for problems or improvements when they arise, but when appropriate, they can also be fed into executive dashboards for tracking as KPIs for the company. We use them ourselves to optimize our own service, and to keep management abreast of overall performance, so we know it works. Loggly not only facilitates capturing vast amounts of log messages but also provides the ability to gather and re-ingest aggregate metrics, facilitating any type of performance-oriented analysis of your valuable data.
The Loggly and SolarWinds trademarks, service marks, and logos are the exclusive property of SolarWinds Worldwide, LLC or its affiliates. All other trademarks are the property of their respective owners.
Mauricio Roman

