Monitoring Loggly AWS CloudTrail Log Ingestion… Using Loggly and CloudTrail
At Loggly, we poke and prod our systems from every angle to make sure we understand as much as possible about how your data is being processed. Distributed systems are complicated, so besides looking at traditional DevOps system metrics, service availability and, naturally, logs, we need to know that all components of a service are working together correctly. AWS CloudTrail log ingestion is no different.
We wanted to set up a monitor that would test the entire length of the CloudTrail pipeline: from a loggable event occurring on Amazon Web Services, to AWS recording it in an S3 bucket, to the Loggly service picking up the event, parsing the JSON into usable fields and indexing them, and, finally, displaying the event in the Loggly GUI.
To feed monitoring information into our CloudTrail pipeline, we needed a steady, predictable stream of API calls to Amazon Web Services. These calls needed to be frequent enough to tell us when the pipeline is running slowly and when it might not be processing at all. We couldn’t rely on the day-to-day API calls made by humans because the timing is unpredictable and we needed 24/7 monitoring. And having the calls generate information we can use in other ways is always a good thing.
So we turned to the AWS command line and one of the simpler (yet rock-solid) tools in our monitoring arsenal: Nagios.
If you’re a command-line AWS user, you’ve probably used ec2-ami-tools and ec2-api-tools, but you may not be familiar with the AWS-built toolkit. AWS’s toolkit, which comes in a Python module and installs in seconds, now provides command-line access to a variety of AWS services, including CloudTrail.
We installed the AWS command line tool (pip install awscli) and then, on the Amazon console, created a dedicated IAM user for monitoring. We then granted that user a keypair and set up policies that gave the user read-only access to our CloudTrail bucket.
To list trails:
$ aws cloudtrail describe-trails –region us-east-1
{
“trailList”: [
{
“IncludeGlobalServiceEvents”: true,
“Name”: “Default”,
“S3BucketName”: “loggly-examplebucket”
}
]
}
With the name and region, we can then poll the trail to make sure it’s tracking API calls:
$ aws cloudtrail get-trail-status –region us-east-1 –name Default
{
“LatestDeliveryTime”: 1398189050.485,
“LatestDeliveryAttemptTime”: “2014-04-22T17:50:50Z”,
“LatestNotificationAttemptSucceeded”: “”,
“LatestDeliveryAttemptSucceeded”: “2014-04-22T17:50:50Z”,
“IsLogging”: true,
“TimeLoggingStarted”: “2014-02-25T23:55:48Z”,
“StartLoggingTime”: 1393372548.497,
“LatestNotificationAttemptTime”: “”,
“TimeLoggingStopped”: “”
}
The Nagios monitor is a simple bash script that checks AWS, using the monitoring user’s credentials, and tells us whether or not IsLogging is returning true. We could add to this and create a more complicated script that crunches the time data and figures out how long ago the last CloudTrail event delivery attempt was, or whether the most recent attempt was successful, but there’s an easier way to see how the information is flowing.
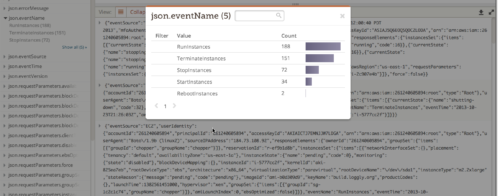
Each time aws cloudtrail get-trail-status runs from Nagios, that generates an API call to AWS — which then gets logged to CloudTrail. We then set up a Loggly alert to track these incoming log messages:
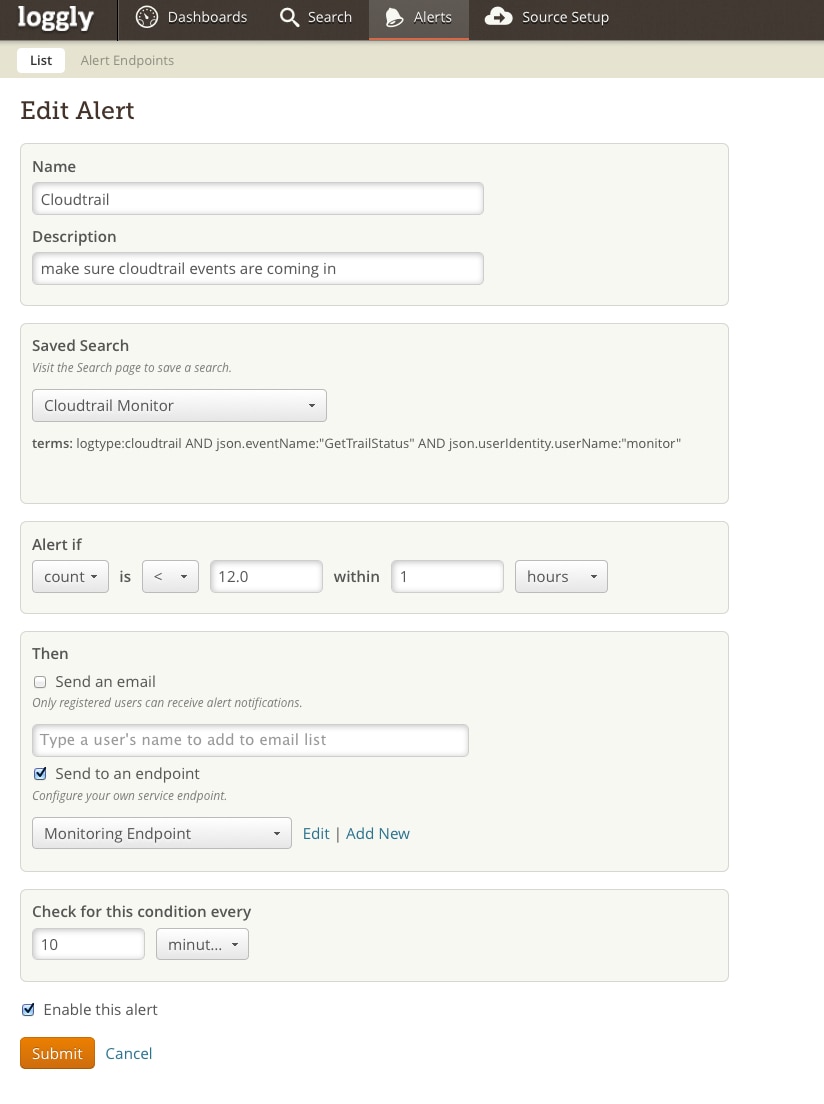
A search for:
logtype:cloudtrail AND json.eventName:”GetTrailStatus” AND json.userIdentity.userName:”monitor”
captures only the GetTrailStatus queries from our monitor:
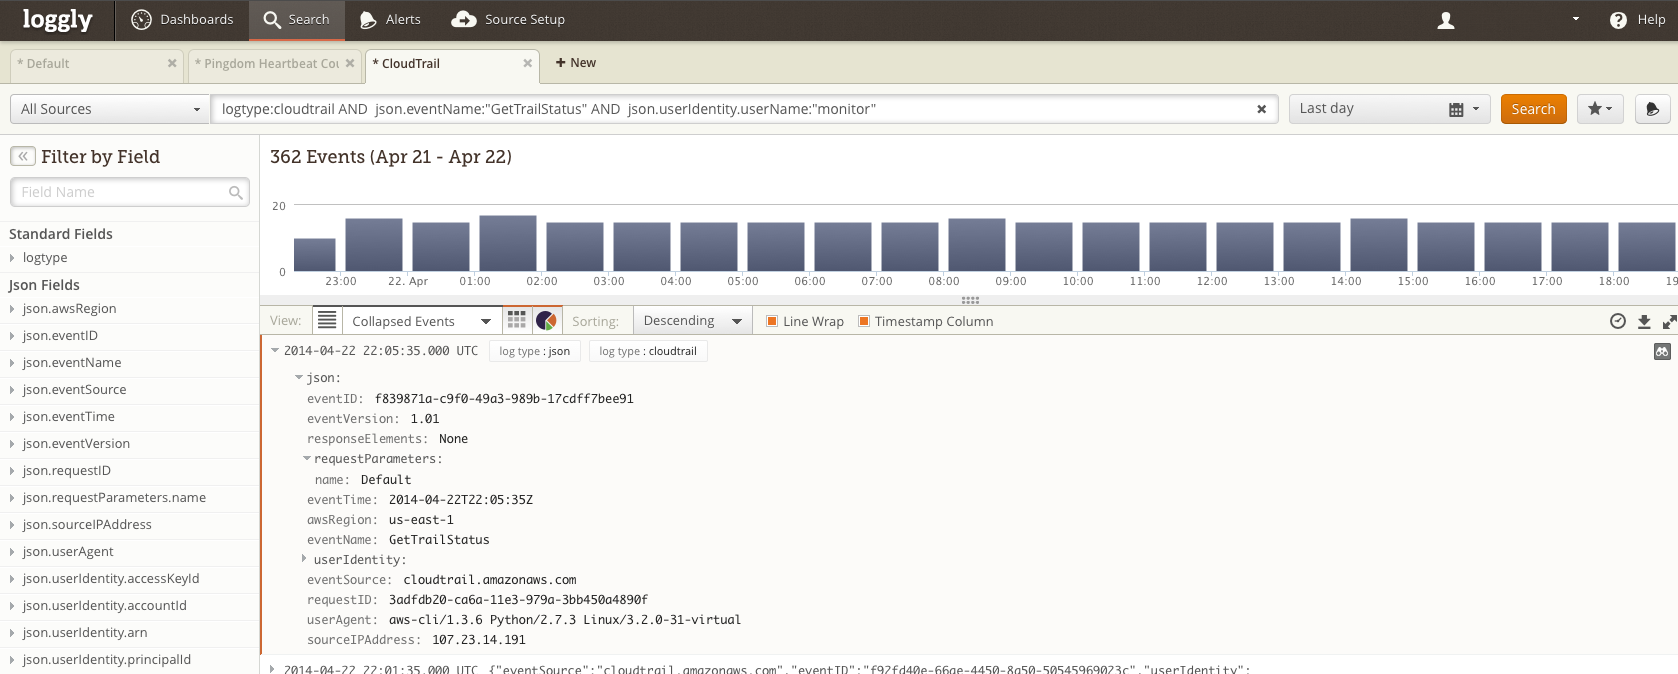
Nagios is checking our trail status (and generating a CloudTrail event) about every 4 minutes, and, because events take about 10 minutes to show up in CloudTrail, the most recent 10 minutes will rarely have an event. So if a rolling check of the previous hour’s GetTrailStatus events from the monitor user shows much fewer than 12 events, something is wrong in the pipeline.
The Nagios monitor tells us whether AWS’ CloudTrail service is picking up the events we ourselves are generating in our day-to-day work in DevOps. At the same time, after it passes through the entire pipeline between us and AWS and back again, we know that Loggly CloudTrail support is working for our customers as well.
Of course, Loggly’s CloudTrail support is useful for many other things besides monitoring CloudTrail. It’ll give you a deeper level of insight into activity on your Amazon Web Services account and let you know quickly when something’s amiss. And, best of all, support for CloudTrail log ingestion is included in your free Loggly trial – you only pay for S3 storage in your AWS account. Give it a try!
The Loggly and SolarWinds trademarks, service marks, and logos are the exclusive property of SolarWinds Worldwide, LLC or its affiliates. All other trademarks are the property of their respective owners.

Hoover J. Beaver