Log Management in the Age of Observability
The explosive growth of interconnected data across distributed systems has disrupted traditional development, DevOps, and ITOps practices and forced many organizations to rethink their cloud strategies.
Higher-velocity feature development and more responsive support requests involve developers throughout the delivery cycle and require them to monitor and observe application behavior before releasing it to production. While some developers might think the required due diligence in dev environments gets in the way of ‘just writing code’, in the long term it can create a smoother, more seamless user experience and reduce the need to fight fires or re-architect your solution after the application is live in production and at scale.
Do logs still matter?
While log management seems like a relic of the days when searching event data meant for each instance of a new server you had to execute a search command across the logs local to that server, the need for log management has been accentuated with the increase in both the quantity of event data and data diversity. Changes to how applications and services are created, the pervasiveness and volatile lifespan of containers, along with the ability to build services using multiple development languages, make the ability to collect, monitor and trace data points across connected systems even more important.
Thanks to containers and VMs, independent dev teams can build in parallel using technologies that are the best fit for the services they are producing, while also sharing environments for builds, staging, and production. With these distributed services, smart log aggregation and management systems can facilitate debugging application errors, exceptions, and performance bottlenecks. A smart log aggregation system makes sense of event data from different technologies produced in various logging formats, and automatically filters out unnecessary or noisy event data that can get in the way of finding the source of an issue.
As projects are broken into smaller pieces, dev teams are collaborating more and across a wider scope of virtual environments and containers. This fragmentation and the need to debug across a variety of systems and languages is prompting teams to extend log aggregation and management across dev and testing environments.
Logs remain an essential element of observability
Developers, SREs, and others who debug and troubleshoot applications and system issues are leveraging the concept of observability. Observability, as understood by the Google Cloud Architecture team, “is tooling or a technical solution that allows teams to actively debug their system. Observability is based on exploring properties and patterns not defined in advance”. To deliver the signal data required to provide this level of visibility, DevOps teams rely on a three-pronged combination of logs, metrics, and traces. Some teams prefer to refer to it as MELT (metrics, events, logs, traces). The principle behind this approach is to take signal data from several vantage points to depict a more accurate view of the overall health and stability of the system:
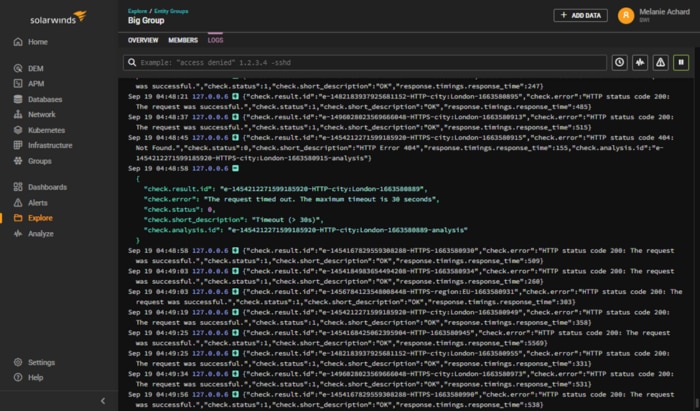
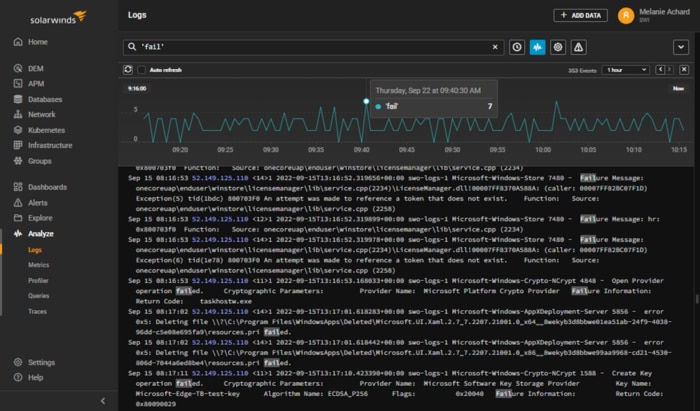
Logs serve as the records of events and messages emitted by a system and can be used to provide insights into system behavior and to help identify issues.
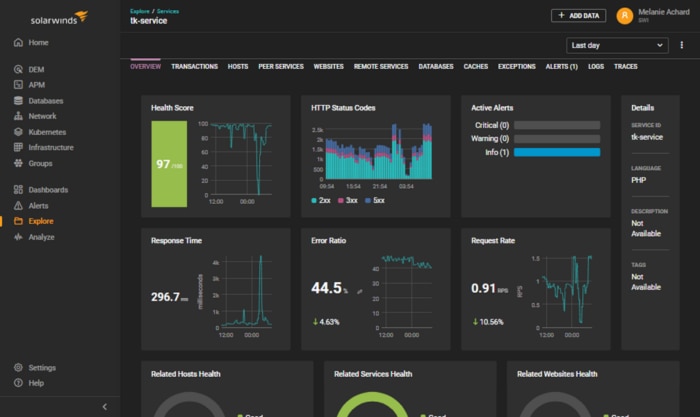
Metrics provide a numerical value that represents the state or performance of a system at a particular point in time and can be used to monitor health and identify trends.
Traces: are a detailed record of a request’s path through a system and are key to understanding the dependencies and interactions between system components.
These signals combine to provide visibility into communications between applications distributed across different systems and containers and to provide context around issues or performance changes.
Whether to identify errors and exceptions in pre-production code, issues during deployment, or optimize performance in production, this data is critical to DevOps teams building elastic and resilient applications. Logs aggregation and management with contextual log search, live-tail, the ability to visually pair log insights with health metrics, and tight integration with distributed tracing, highlight the value of log data in achieving observability.
What Lies Ahead For Logs?
ITOps has long relied on logs when systems fail, or users can’t access them. Locating the relevant log file and searching event data is often the first step when troubleshooting and reacting to a system failure. Log data is also essential to an incident postmortem, where after the system is restored, the team analyses the series of events that preceded the incident to understand the root cause and identify measures to prevent a future incident. In both cases, the event data becomes the system of record after the fact.
ITOps has long relied on logs when systems fail, or users can’t access them. Locating the relevant log file and searching event data is often the first step when troubleshooting and reacting to a system failure. Log data is also essential to an incident postmortem, where after the system is restored, the team analyses the series of events that preceded the incident to understand the root cause and identify measures to prevent a future incident. In both cases, the event data becomes the system of record after the fact.
With the increase in adoption of continuous integration and delivery methodologies, where every code change triggers an automated build and test, event data is finding increasing importance earlier in the development cycle. Coupled with metrics and traces, log and event data are enabling DevOps teams to participate in architectural discussions at project inception, instead of in the latter stages or at release.
Early involvement allows the team, specifically site reliability engineers or platform engineers, to understand the development and architectural principles used to develop application services. Armed with this deeper understanding, they can plan and build in automation, as well as high availability and circuit breaker patterns to provide continuous and uninterrupted service and prevent cascading failures in microservices from inception. In this new approach, log and observability data is used proactively. Instead of troubleshooting issues in production, DevOps teams auto-scale and replace to minimize disruptions and investigate the incident offline when possible.
Interested in seeing how log data contributes to observability? Take a few minutes to explore the SolarWinds Observability SaaS interactive demo. It’s a hands-on demo environment populated with real-time data from an online application to allow users to see how the telemetry signals combine to provide holistic visibility.
The Loggly and SolarWinds trademarks, service marks, and logos are the exclusive property of SolarWinds Worldwide, LLC or its affiliates. All other trademarks are the property of their respective owners.

Melanie Achard