Loggly 3.0: Connecting the dots with unified log analysis and monitoring
I’m thrilled to announce the arrival of Loggly 3.0. The most significant update ever for our cloud-based solution now provides unified log analysis and monitoring, as well as direct, visible connections between logged exceptions and the source code that generated them. With Loggly 3.0, we’re connecting the dots between metrics, root cause analysis via log data, and our customers’ development and operations processes.
Loggly 3.0 is the result of months of hard work, from initial surveys to in-depth customer interviews to interactive design mock-up reviews. We received feedback from emerging cloud-based product leaders and Fortune 500 companies, as well as from the largest beta program we’ve ever executed. We’re excited to finally deliver these capabilities to our customers.
Modern software demands new monitoring and analysis capabilities
Enterprises that have deployed modern software solutions–that is, our customers–are facing exploding data volumes generated by dynamic infrastructure, microservices, and countless devices, not to mention the constant change of continuous delivery. Consider this: In a 2017 survey by the Digital Enterprise Journal, respondents reported an average 88% increase in the number of processed metrics, events, and alerts over the last 12 months.
While our customers have brought in more and more DevOps solutions and homegrown tools to solve specific pain points, they’re also looking to get more value from their existing solutions. Loggly has answered their call.
Now available: Unified log analysis and monitoring
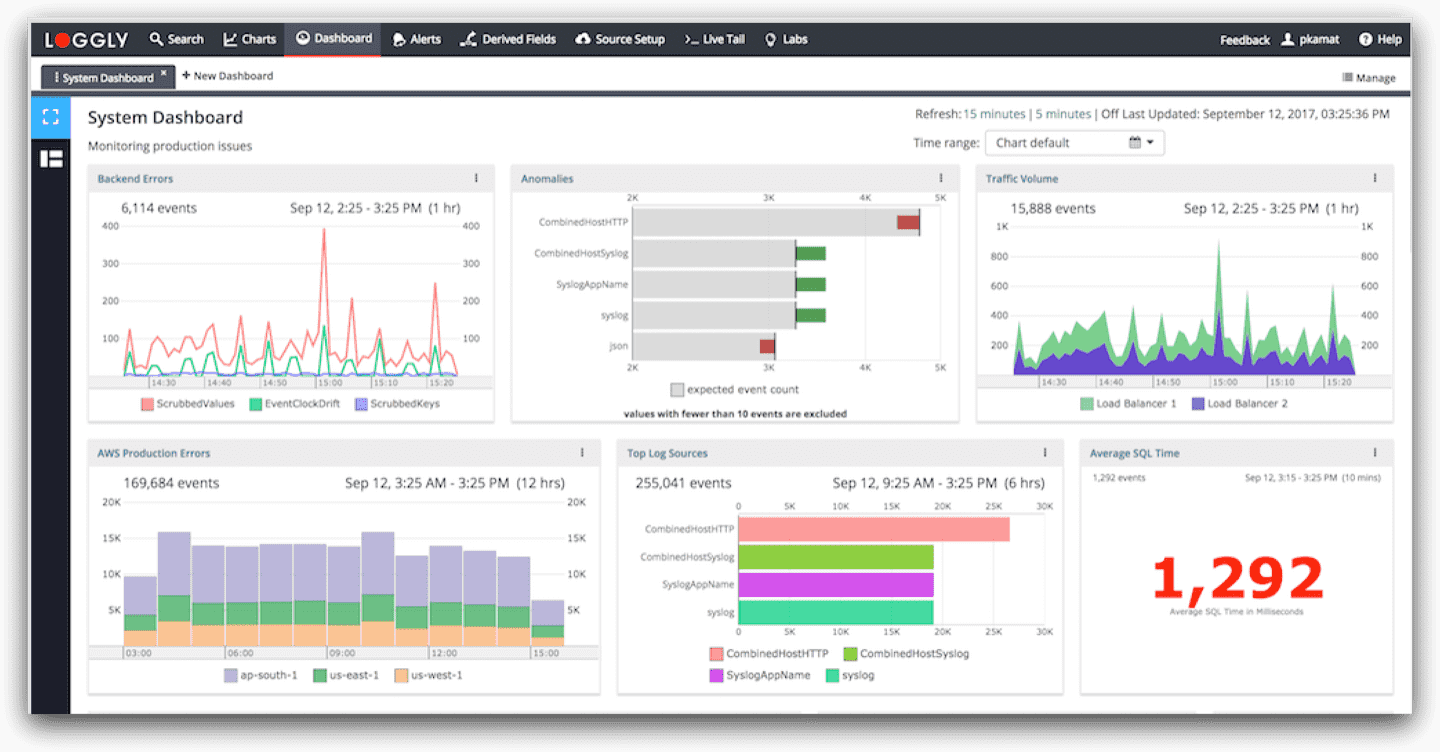
Loggly 3.0 provides comprehensive monitoring with data and metrics from many sources – combined with deep analysis capabilities with log data. We’ve completely redesigned our charts and dashboards so that our users can see the full story with multiple visualization options from which to choose. In addition to the ability to display any log-resident or Amazon CloudWatch metric, Loggly will support metrics collection using the collectd daemon in the fourth quarter of 2017.
Teams can now:
- Create new, dynamic charts and dashboards with just a few clicks
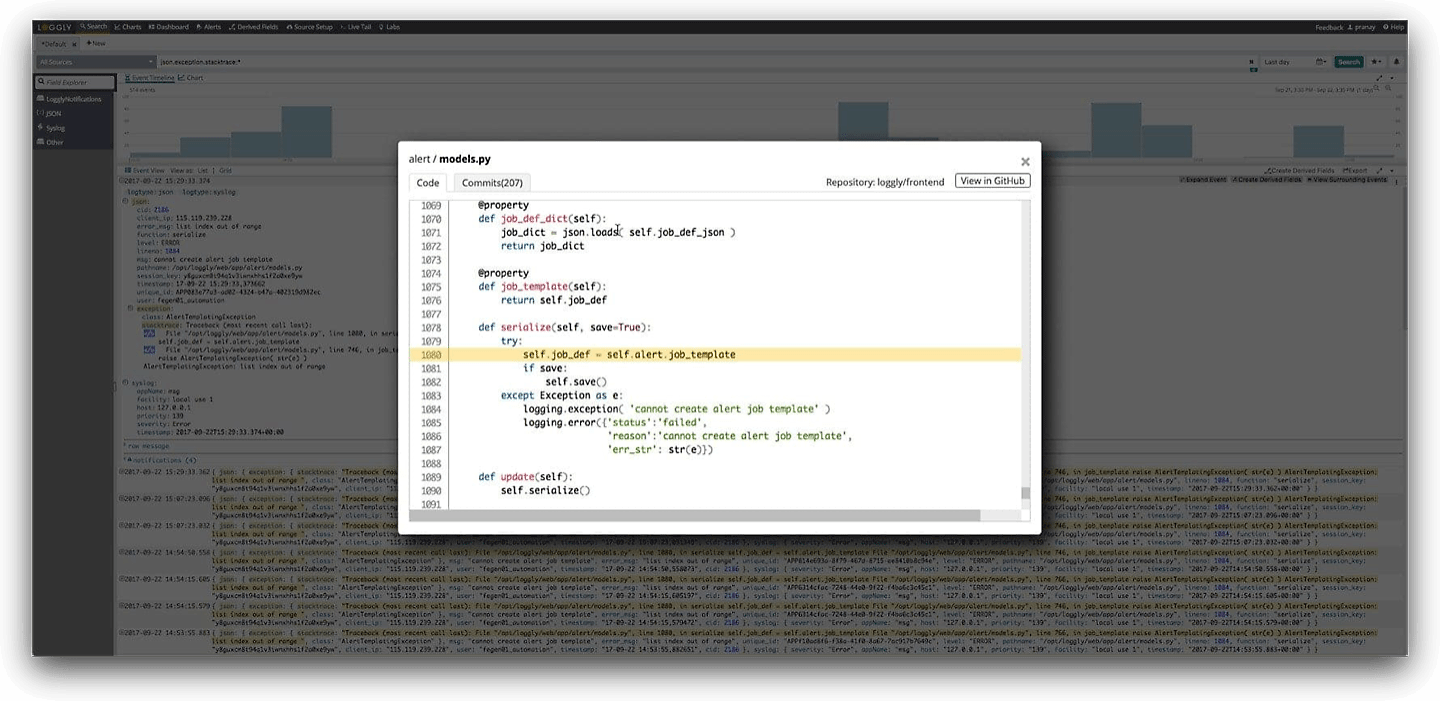
- Connect insights from dashboards to logs to source code in GitHub
- Contextually correlate metrics and logs for deeper insight and faster drill-down
- Examine timeshift charts for data comparison across time periods
- Keep track of important metrics by “pinning” data for continuous display
- Share dashboards for better communication and faster root cause analysis
Collaboration throughout the software lifecycle
Loggly 3.0 encourages teamwork by integrating data and analysis with the DevOps toolchain. It addresses multiple points where logs and metrics touch other software development processes, from:
- Performance monitoring with integration to New Relic APM
- Escalation: PagerDuty, VictorOps, and more
- Team collaboration: Slack, HipChat, Microsoft Teams
- Issue tracking: Jira Software
- Identifying and viewing the specific line of code causing exceptions, right from within Loggly, via our unique GitHub integration (stay tuned for details in an upcoming blog post by Pranay Kamat)
Unified log analysis and monitoring deliver a better user experience
Ultimately, connecting the dots is about creating a better experience. Loggly 3.0 gives you new ways to:
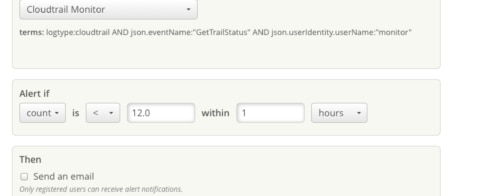
- Improve service quality and prevent revenue leaks through proactive monitoring of a broad set of application KPIs in real time and the deep analysis needed to know where to make improvements
- Reduce mean time to resolution (MTTR) through rapid root cause analysis, full-stack visibility and contextual correlation of events and insights
- Reduce complexity with one unified tool for monitoring and log analysis
- Improve teamwork with a shared source of truth about what’s happening
- Communicate major trends and KPIs to align development activities with company objectives
See Loggly 3.0 in our webinar
Next week, we’ll be hosting a webinar featuring Mike Julian, author of Practical Monitoring. He will join Desmond Chan, Senior Director of Product Marketing at Loggly, and Pranay Kamat, Product Manager at Loggly, to discuss monitoring trends and to share a peek at Loggly 3.0.
When: Thursday, October 12, 2017, 9:00 AM PT/ 12:00 PM ET
Where: At your desk
You can register for the webinar here.
Try Loggly 3.0 for yourself!
Loggly 3.0 is now available to trial users and customers with Enterprise subscription plans. Standard and Pro customers will have access within the coming week. The GitHub integration is part of the Enterprise subscription plan and is also available to trial users. Charts and dashboards are available with all Loggly paid plans.
Whether you are a long-time Loggly customer or someone who has never taken advantage of our 14-day free trial, it’s time to get started!
The Loggly and SolarWinds trademarks, service marks, and logos are the exclusive property of SolarWinds Worldwide, LLC or its affiliates. All other trademarks are the property of their respective owners.

Loggly Team