Monitoring RDS performance with Enhanced Metrics managed in Loggly
- Amazon RDS 101
- Loggly: an integrated log management solution
- System setup
- Creating a simple dashboard
- Load testing the RDS instance
- Conclusion
Amazon RDS 101
Amazon Relational Database Service (RDS) is a managed database solution from Amazon Web Service that enables businesses to run their traditional database workload in the cloud. Unlike on-premise or even EC2-based servers, customers don’t have to worry about setting up database nodes, configuring high availability, backups, security, encryption, or software patching. Everything is handled by AWS: all users need to do is set up the instance and start creating their databases in it.
At the time of writing, Amazon RDS supports multiple database platforms, including:
- Microsoft SQL Server
- Oracle
- PostgreSQL
- MySQL
- MariaDB
Also, Amazon has incorporated variances of MySQL and PostgreSQL in its Aurora database class.
Being a managed service, this also means users have few controls on the underlying operating system or the database engine. Users cannot SSH or RDP into an RDS instance, nor can they modify some of the configuration parameters. Privileged file system operations or superuser access is also restricted.
Monitoring RDS instances
Amazon RDS instances could be monitored in two different ways:
- From the RDS performance counters available in Amazon CloudWatch
- From the RDS database instance logs available from the AWS console or third-party tools
The image below shows the CloudWatch metrics from a MySQL RDS instance:
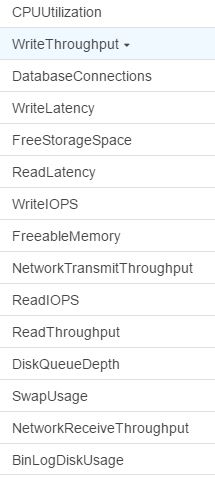
However, these metrics are available from the hypervisor level (i.e., they are exposed by the underlying host and not by the VM). So for example, if we are looking for say, %CPU utilized by user processes in the database server itself, only an approximation is available in CloudWatch. There may be a small difference depending on how much CPU is used by the hypervisor layer. Additionally, you will not get visibility into CPU usage from individual processes.
RDS Enhanced Monitoring
In 2016, Amazon launched RDS Enhanced Monitoring, a feature that enables users to collect metrics from the database server’s operating system. This is definitely a major improvement and good news for DBAs and database engineers.
With Enhanced Monitoring, low-level information from the instance’s operating system are passed to CloudWatch logs. It’s also possible to specify how frequently the metrics will be collected.
Using Enhanced Monitoring is simple. It can be enabled when an instance is created or switched on for an existing instance. All RDS requires is an IAM role with read/write access to CloudWatch logs.
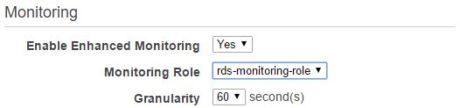
As the image below shows, there are only three options for RDS Enhanced Monitoring:

To enable Enhanced Monitoring, the “Enable Enhanced Monitoring” option has to be set to “Yes.”
The monitoring role is an IAM role with access to CloudWatch logs. This role will have to be created before enabling Enhanced Monitoring. However, we do not have to manually grant any specific privileges to this role when creating it. There is already an AWS service role called “Amazon RDS Role for Enhanced Monitoring” that we can assign as a role type.
Finally, granularity defines how often metrics will be collected. This can be set up to 60 seconds.
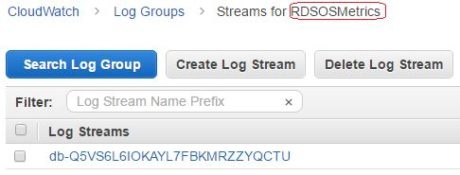
Once enabled for an RDS instance, the enhanced metrics are published in CloudWatch logs under a log group called RDSOSMetrics. Under this log group, there will be separate log streams containing Enhanced Monitoring data for each configured RDS instance. Here is an image of one such log stream:
The streamed data is basically a long JSON string that can be consumed by any application using CloudWatch APIs. The following code block shows one such JSON document:
{
    "engine": "MySQL",
    "instanceID": "rds-mysql-loggly",
    "instanceResourceID": "db-KN5ZWLN6W2DBRCOZ33QYMN7W6U",
    "timestamp": "2017-02-13T09:49:50Z",
    "version": 1,
    "uptime": "0:05:36",
    "numVCPUs": 1,
    "cpuUtilization": {
        "guest": 0,
        "irq": 0.02,
        "system": 1.02,
        "wait": 7.52,
        "idle": 87.04,
        "user": 1.91,
        "total": 12.96,
        "steal": 2.42,
        "nice": 0.07
    },
    "loadAverageMinute": {
        "fifteen": 0.12,
        "five": 0.26,
        "one": 0.27
    },
    "memory": {
        "writeback": 0,
        "hugePagesFree": 0,
        "hugePagesRsvd": 0,
        "hugePagesSurp": 0,
        "cached": 505160,
        "hugePagesSize": 2048,
        "free": 2830972,
        "hugePagesTotal": 0,
        "inactive": 363904,
        "pageTables": 3652,
        "dirty": 64,
        "mapped": 26572,
        "active": 539432,
        "total": 3842628,
        "slab": 34020,
        "buffers": 16512
    },
    "tasks": {
        "sleeping": 157,
        "zombie": 0,
        "running": 2,
        "stopped": 0,
        "total": 160,
        "blocked": 1
    },
"swap": {
        "cached": 0,
        "total": 3847560,
        "free": 3847560
    },
    "network": [
        {
            "interface": "eth0",
            "rx": 474.28,
            "tx": 3984.58
        }
    ],
    "diskIO": [
        {
            "writeKbPS": 9510.07,
            "readIOsPS": 0.1,
            "await": 7.83,
            "readKbPS": 1.6,
            "rrqmPS": 0,
            "util": 7.7,
            "avgQueueLen": 36.04,
            "tps": 76.73,
            "readKb": 96,
            "device": "rdsdev",
            "writeKb": 570604,
            "avgReqSz": 123.96,
            "wrqmPS": 0,
            "writeIOsPS": 76.63
        }
    ],
    "fileSys": [
        {
            "used": 351568,
            "name": "rdsfilesys",
            "usedFiles": 304,
            "usedFilePercent": 0,
            "maxFiles": 6553600,
            "mountPoint": "/rdsdbdata",
            "total": 103053476,
            "usedPercent": 0.34
        }
    ],
    "processList": [
        {
            "vss": 3109256,
            "name": "mysqld",
            "tgid": 2625,
 "parentID": 1,
            "memoryUsedPc": 6.25,
            "cpuUsedPc": 0,
            "id": 2625,
            "rss": 239984
        },
        {
            "vss": 617860,
            "name": "OS processes",
            "tgid": 0,
            "parentID": 0,
            "memoryUsedPc": 0.47,
            "cpuUsedPc": 0.04,
            "id": 0,
            "rss": 18524
        },
        {
            "vss": 979868,
            "name": "RDS processes",
            "tgid": 0,
            "parentID": 0,
            "memoryUsedPc": 4.38,
            "cpuUsedPc": 1.97,
            "id": 0,
            "rss": 168124
        }
    ]
}
As we can see, information contained in the JSON document can be quite valuable for performance monitoring.
Loggly: an integrated log management solution
Loggly is a Software-as-a-Service (SaaS) solution with a very strong market presence. It can capture logs from a wide variety of sources including Amazon CloudWatch. The collected logs can be searched, analyzed, correlated, and used for advanced features like plotting trends, detecting anomalies, or sending alerts.
Loggly offers an AWS Lambda blueprint available from the AWS Lambda console. This enables customers to configure a predefined template to capture CloudWatch logs and ingest them into their Loggly accounts. For companies using Loggly as a solution, this is beneficial because all the logs can be consolidated in one place.
AWS Lambda blueprint from Loggly
For those who are new to AWS Lambda, this is a serverless computing service where users don’t have to worry about creating and maintaining infrastructure resources for running their code.
AWS Lambda users write small application code blocks in Node.js, Python, or Java and upload it in the Lambda environment. These code blocks are called Lambda functions. Once uploaded, the function can be executed in response to an event or a set schedule and perform some specific task. An example of such a task is copying Amazon CloudWatch log stream data into Loggly.
Readers who are interested to know about the Loggly AWS Lambda blueprint can refer to this blog post.
Overview of our RDS performance monitoring use case
In this article, we will see how Loggly can work as a performance monitoring system for Amazon RDS. For this, we will create a MySQL RDS instance with Enhanced Monitoring. This will send database instance OS metrics to a CloudWatch log stream.
We will then create a Lambda function from the Loggly blueprint to capture CloudWatch logs. To configure it, we will choose the log group created by CloudWatch for the RDS metrics.
Once the function starts sending the log streams from the log group, we will be able to see the data in Loggly. We will then use the Loggly derived fields feature to parse the JSON strings sent with each event. These derived fields will help us create widgets from our search. The widgets will be used to create a dashboard showing critical OS level graphs.
Finally, we will generate test data in the RDS instance with a tool called HammerDB which will send repeated queries to the instance with dummy data. With the loading, we can use the dashboard to see how computing resources like CPU, memory, or disk IO are trending.
For simplicity, we will create all components in the same AWS region.
System setup
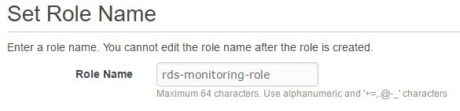
Create IAM role for Enhanced Monitoring
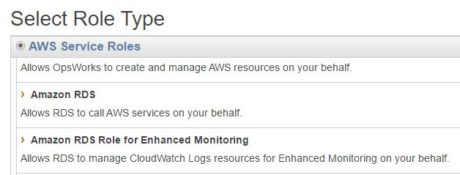
RDS instances with Enhanced Monitoring will require read/write access to Amazon CloudWatch logs. For this, the RDS instance will assume an IAM role with appropriate rights. In the following images, we are creating the role, “rds-monitoring-role”:
The selected role type should be “Amazon RDS Role for Enhanced Monitoring”:
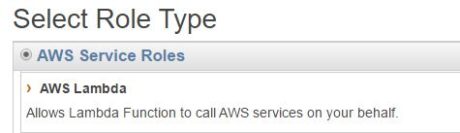
Create IAM role for AWS Lambda function
Like the RDS instance, the Lambda function will also need to access the CloudWatch logs. The function will have to assume an IAM role, giving it the privilege to read from and write to CloudWatch logs.
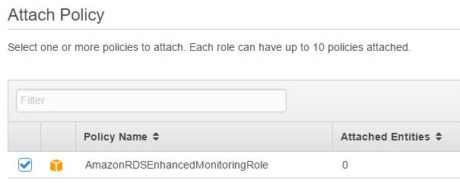
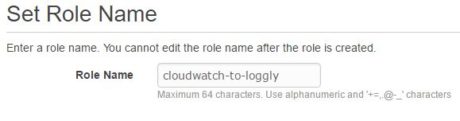
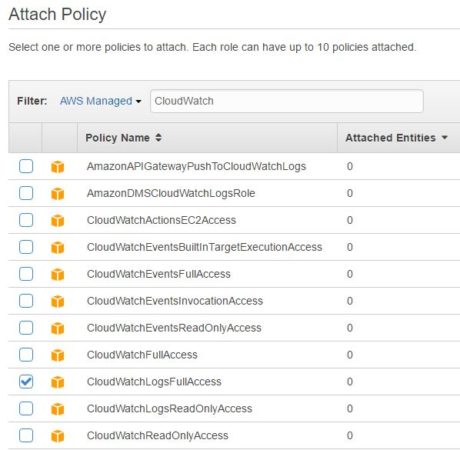
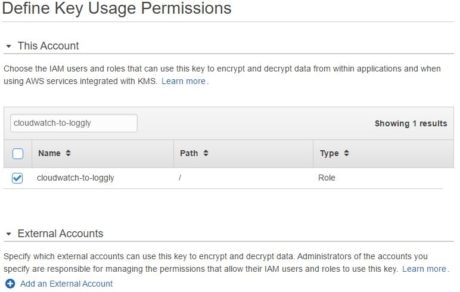
In the following images, we are creating one such role called “cloudwatch-to-loggly”. For simplicity’s sake, we are using a built-in policy that gives the role full access to CloudWatch logs:
Create KMS key
Next, we will create a key in the AWS Key Management Service (KMS). KMS is Amazon’s managed key provider. Keys created here can be used to encrypt disk volumes, RDS instances, or sensitive information. Keys can be rotated based on a schedule or retired when no longer required.
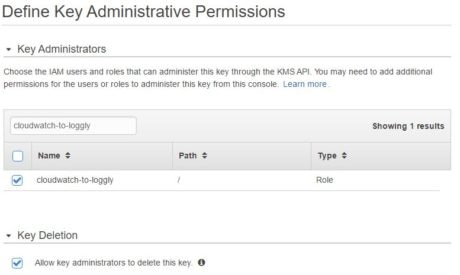
We will require this key to encrypt the Loggly customer token used in the Lambda function. We will also configure the cloudwatch-to-loggly IAM role with administrative and usage rights on the key. With these privileges, the Lambda function will be able to encrypt and decrypt the customer token.
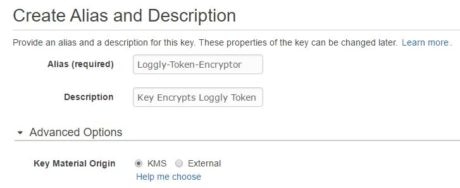
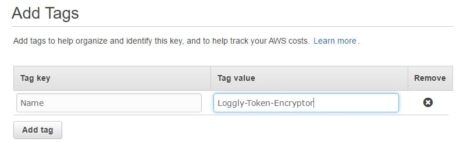
In the following images, we are creating a KMS key called “Loggly-Token-Encryptor”:
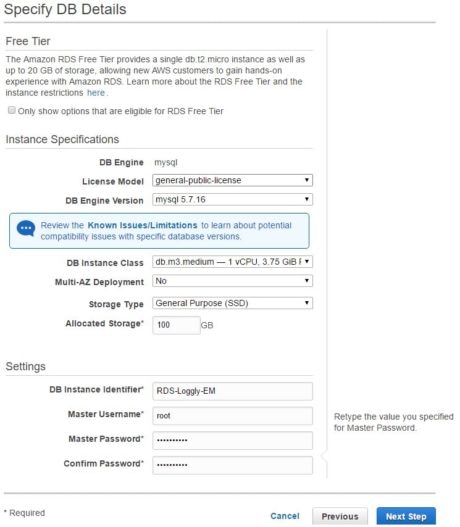
Create RDS instance
With the prerequisites out of the way, we will now create an RDS instance. As the following images show, we are creating a MySQL instance called “RDS-Loggly-EM”. We are also using Enhanced Monitoring for the instance. Note how we have to choose the IAM role rds-monitoring-role:
The RDSOSMetrics CloudWatch log group
Once the instance is created, we can look at CloudWatch logs from the AWS console. There should be a log group called “RDSOSMetrics” already created there. Inside the log group there will be one or more log streams.
Create AWS Lambda function
Next, we will create an AWS Lambda function from the Loggly CloudWatch blueprint. The following images show how we are creating the Lambda function:
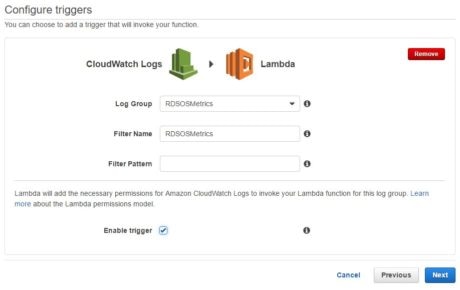
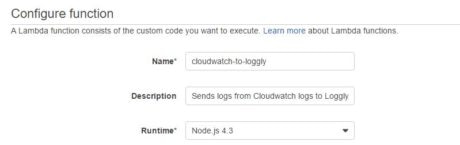
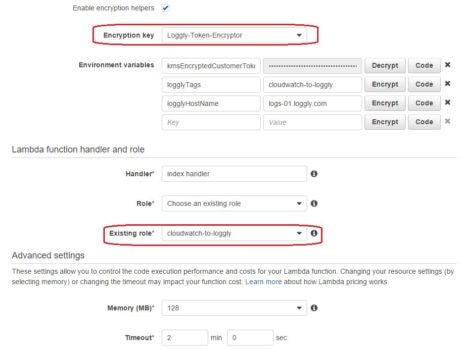
There are three things to note here:
- We are using the KMS key “Loggly-Token-Encryptor” to encrypt the Loggly customer token.
- We are using the “cloudwatch-to-loggly” IAM role for the function.
- We are specifying a tag we can search the events with: “cloudwatch-to-loggly”.
Once the function is created, we can check the monitoring page for any invocation errors. If everything is okay, there should be none.
The function will now be sending any CloudWatch log data (including those from RDS enhanced metrics) to Loggly.
CloudWatch logs in Loggly
We will now be able to watch the RDS Enhanced Monitoring data from Loggly using the tag specified in the function. In the following image, we are looking at the log entries already streamed:
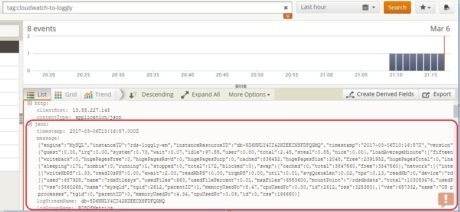
As you can see, the log entries consist of a “message” field which contains a long JSON document. Unfortunately we cannot create any meaningful visuals from this message field.
Creating a simple dashboard
A standalone “message” field is not of much use, so we will need to find some way to parse its JSON contents.
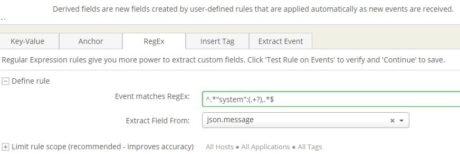
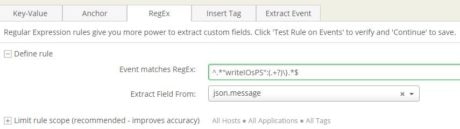
Creating derived fields
Loggly has a feature called derived fields, which enables users to create custom calculations on input fields and create new fields from them. The calculations can be based on regular expressions (regexes). Derived fields are not present in the input log stream, but are calculated immediately after log data has been ingested into Loggly.
To find meaningful bits of information from the message field, we created a number of these derived fields. Two of these are shown in the images below:
The following is a complete list:
| Derived Field | RegEx | Description |
|---|---|---|
| cpu_system | ^.*"system":(.+?),.*$ | % of CPU used by OS |
| cpu_wait | ^.*"wait":(.+?),.*$ | % of CPU unused while waiting for I/O |
| cpu_idle | ^.*"idle":(.+?),.*$ | % of CPU idle |
| cpu_user | ^.*"user":(.+?),.*$ | % of CPU used by user processes |
| loadAverageMinute-5min | ^.*"readIOsPS":(.+?),"await":.*$ | Number of processes requesting CPU time in last five minutes |
| diskIO_readIOsPS | ^.*"writeIOsPS":(.+?)\}.*$ | Disk read operations / second |
| diskIO_writeIOsPS | ^.*"writeIOsPS":(.+?)\}.*$ | Disk write operations / second |
| fileSys_usedPercent | ^.*"usedPercent":(.+?)\}\],.*$ | % of the file-system disk space in use |
| tasks_blocked | ^.*"blocked":(.+?)\},.*$ | Number of tasks currently blocked |
| memory_free_kb | ^.*"free":(.+?),"hugePagesTotal".*$ | Free memory in KB |
| mysql_mem_used_percent | ^.*"parentID":1,"memoryUsedPc":(.+?),"cpuUsedPc":.*$ | % of memory used by MySQL process |
Creating widgets
Once the derived fields are created, we can use the grid view of the search screen to add event timestamps against each derived field and create trend graphs. In the image below we created one such grid view from event timestamps and diskIO_writeIOsPS (disk write IOs per second) derived field:

Creating trend graphs
Next, choosing the “Trend” option, we can plot these values as a line chart, which looks like this:
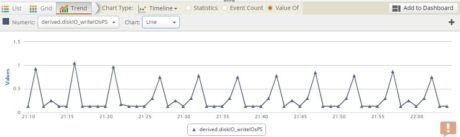
Clicking the “Add to Dashboard” button will allow us to save this graph as a “Widget” which can later be used in a custom dashboard.
Adding widgets to the Loggly dashboard
We can now create a dashboard from the saved widgets. A dashboard is a great place where DBAs, system administrators, application owners, or operations teams can have a bird’s eye view of the RDS instance’s performance.
To create a dashboard, we can start with an empty palette and add the saved widgets. The image below shows a simple dashboard for our RDS instance. It’s displaying CPU, disk IO, and load profiles:
Load testing the RDS instance
To further test the widgets’ trend lines, we ran a load test against our RDS instance. We used a tool called HammerDB for this purpose. HammerDB is an open-source database load testing and benchmarking tool that can be used to run OLTP workloads against a number of database platforms. HammerDB performs the load test based on the TPC-C specification.
We will not go into the details of how to run HammerDB; users can view the documentation here. In short, HammerDB does the following:
- Connect to the target database instance
- Create a test database schema and load it with sample data (configured during test setup process). This database is based on an order fulfilling application
- Run a number of transactions for a number of concurrent users (again, configured during test setup)
- Display the transaction-per-minute results when test is finished
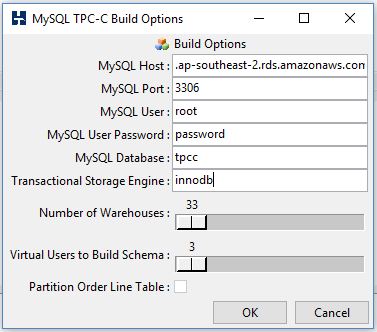
The following image shows the HammerDB schema build options chosen for loading data in the RDS instance. We are using three virtual users to build the schema:
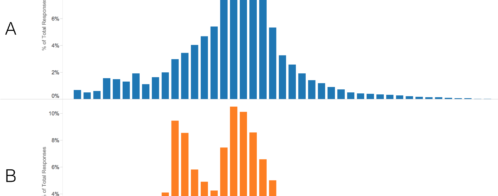
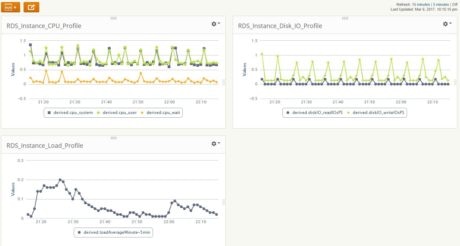
We created a custom dashboard in Loggly and observed it during the data load process. The images below show CPU, memory, and disk I/O profiles:
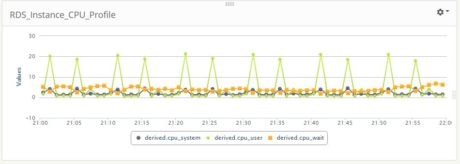
As we can see, the CPU load is not too much. The user processes (data load) are making the %CPU user time to go up and down in a saw-tooth fashion at regular intervals.
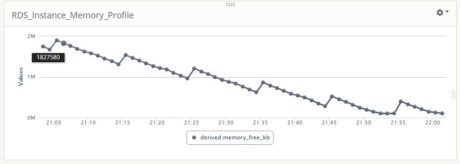
The memory is taking a hit during the load process. At the very end, free memory was approaching towards zero KB.
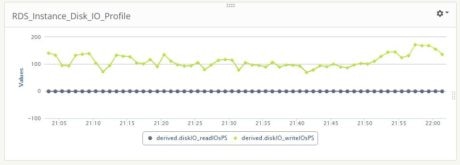
We can see the load is a write-only process: the disk read IOs/second is static at almost zero. The write process is fairly intensive: on average, there are more than 100 write operations per second.
Conclusion
In this post we have seen how Loggly can be effectively used as a performance monitoring platform for Amazon RDS. Of course this does not replace any dedicated performance monitoring application, but the information displayed is useful enough for troubleshooting purposes, particularly when you can correlate metrics to other application and system logs in a single system.
Although we only covered a few metrics here, system administrators should start parsing Enhanced Monitoring logs to find other meaningful information like swap file usage, incoming and outgoing network traffic, or average disk queue lengths. Also, capturing normal workload profiles through the Loggly dashboard can be useful in creating a benchmark for any system.
The Loggly and SolarWinds trademarks, service marks, and logos are the exclusive property of SolarWinds Worldwide, LLC or its affiliates. All other trademarks are the property of their respective owners.

Sadequl Hussain