Performance Monitoring with Amazon CloudWatch Metrics Managed in Loggly
Loggly: An Integrated Log Management Solution
Capturing Amazon CloudWatch Metrics in Loggly
Performance Monitoring: Loggly vs Amazon CloudWatch
Setting Up the AWS Lambda Function
Scenario 1: EC2 Server Running Load Test
Scenario 2: RDS Instance Running SQL Server
Scenario 3: EC2 Server Running MySQL
Scenario 4: Non-AWS Hosted Server Running MySQL
Installing Loggly Application Pack for CloudWatch Metrics
Amazon CloudWatch Metrics 101
Amazon CloudWatch is an integral part of Amazon Web Services and is used to monitor other AWS services like EC2, Redshift, or RDS. Almost all AWS services expose their performance metrics to Amazon CloudWatch. Based on the metric’s value and any threshold set, Amazon CloudWatch can fire alerts to notify system administrators, or take actions like stopping, starting, or destroying server instances.
Most Amazon CloudWatch performance counters like CPU, Network, or Disk IO are collected from the host level. With a little tweaking, it’s also possible to capture operating system counters like memory or disk latency. By default, the metrics are collected every five minutes, but it’s also possible to have finer control by letting Amazon CloudWatch collect them every one minute. These metrics are available online for 15 days. Due to the graphical nature of Amazon CloudWatch, it’s thus easily possible to build retrospective trend graphs from the collected data.
Amazon CloudWatch also enables us to create dashboards from individual metric widgets. With dashboards, it’s now possible to create customized layouts that can correlate different performance metrics and provide more holistic insight.
Loggly: An Integrated Log Management Solution
Loggly is a Software-as-a-Service (SaaS) solution with a very strong market presence. It can capture logs from a wide variety of sources. The collected logs can be searched, analyzed, correlated, and used for advanced features like plotting trends, detecting anomalies, or sending alerts. Configuring a server for Loggly is not difficult at all since no agent installation is necessary. All Loggly needs is a logging service like rsyslog or NXlog running in the machine and forwarding log files to its HTTP/HTTPS endpoint.
Back in April 2016, we published a blog about how to send Amazon CloudWatch logs to Loggly with the help of an AWS Lambda function. As we mentioned in that post, Amazon CloudWatch is now able to capture logs from a number of resources like Amazon EC2, AWS Lambda, or AWS CloudTrail. For EC2 instances that can’t be directly integrated with Loggly (perhaps due to firewall rules), this is a nice workaround: instances can send logs to Amazon CloudWatch, and a simple AWS Lambda function in the background can re-stream those logs to Loggly.
Capturing Amazon CloudWatch Metrics in Loggly
Although Loggly is primarily a log management solution, it’s now also possible to monitor system performance with it to a certain degree. The performance monitoring capability is tightly tied with Amazon CloudWatch and once again, an AWS Lambda function is used for streaming the CloudWatch metrics to Loggly.
Performance Monitoring: Loggly vs Amazon CloudWatch
So why should we want to capture Amazon CloudWatch metrics in Loggly? After all, both the platforms can stream resource logs as well metrics into meaningful dashboards. Other than this, both can display performance data in local or UTC time. So why use another technology?
The simple answer is this: Loggly can help us correlate log data with performance data in the same screen, providing further insight when troubleshooting resource bottlenecks or unexpected service degradation. Also, there are some important differentiators:
- Loggly can manage logs and performance counters from both on-premise and cloud-hosted infrastructure. And the cloud does not have to be AWS-only. A wide variety of sources are available. For use cases where AWS-hosted resources cannot directly stream to Loggly, Amazon CloudWatch logs can be used as an effective intermediary.Compared to this, Amazon CloudWatch can host performance metrics and logs from AWS-hosted components only.
- In Loggly, it’s possible to build trend graphs from embedded performance data in log files. This is not possible in Amazon CloudWatch. Amazon CloudWatch logs and performance metrics are two different things.
- Users can create dashboards in both Amazon CloudWatch and Loggly. However, Loggly dashboards offer features not present in Amazon CloudWatch. For example, it allows custom alerts, saved searches, or top value counters to be integrated into dashboards. You can also share Loggly dashboards with other Loggly users, something not possible with Amazon CloudWatch.
- Correlating Amazon CloudWatch metrics with application logs enables us to troubleshoot problems faster by comparing information from multiple sources and drilling down into specific events. We’ll take a look at sample use cases shortly.
- Amazon CloudWatch metrics are available for 15 days only. Loggly Pro and Enterprise plans allow for up to 90 days of log retention, but log files can also be saved in Amazon S3 buckets. This means log files with embedded performance metrics can be accessed later if necessary.
- Be default, Amazon CloudWatch metrics are collected every five minutes, although it can be tuned up to every one minute. For optimal performance, the AWS Lambda function for Amazon CloudWatch metric collection is best invoked every five minutes. This means Amazon CloudWatch can provide a more granular view of the data.
- Amazon CloudWatch dashboards can be adjusted dynamically. For example, we can manipulate the granularity of time axis, reporting period, or even auto-refresh interval for widgets. Compared to this, Loggly dashboards cannot be adjusted dynamically. Widgets are created from saved searches in Loggly and the only way to customize the widget is to modify the underlying search period.
- Finally, both Amazon CloudWatch and Loggly can raise alerts based on predefined thresholds.
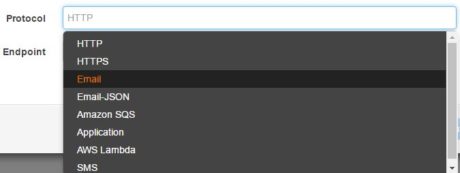 With Amazon CloudWatch, the alert notifications can be channeled to a Simple Notification Service, which can further route the notice to a HTTP/HTTPS, Application, SQS, Lambda, or email endpoint.
 Compared to that, Loggly alerts can be channeled to HTTP as well as HipChat, Slack, or PagerDuty endpoints, which are very useful for operational support.
Use Cases
In this blog post, we will show two test cases where Loggly will capture Amazon CloudWatch metrics for AWS resources. We will build meaningful dashboards by integrating those metrics with Loggly’s advanced features. We will also show a use case where the customer is not using AWS, but hosting either on-premise or with another cloud service provider. Amazon CloudWatch has no involvement in the latter case, but Loggly still plays a vital role.
Most of our tests will involve measuring CPU performance of database systems like MySQL or MS SQL Server. However, readers can easily modify the workflow for their own use cases.
Briefly, the scenarios will be:
- Loading the CPU of an empty EC2 instance with a stress test tool and capturing its CPUUtilization CloudWatch metric in Loggly.
- Loading the CPU of an Amazon SQL Server RDS instance with a custom query and capturing the CPUUtilization metric for the RDS instance.
- Loading the CPU of a MySQL EC2 instance with the mysqlslap utility. Again the CPUUtilization metric will be captured from Amazon CloudWatch.
- Running the mysqlslap tool in a DigitalOcean Droplet running MySQL. A custom shell script will collect the CPU performance and stream it to Loggly.
Setting Up the AWS Lambda Function
As we mentioned before, there is an AWS Lambda function that can copy Amazon CloudWatch metrics to Loggly. This function is freely downloadable from GitHub. Before we begin our tests, we need to set up that Lambda function. The process is not difficult, and there is already a post in Loggly documentation about it.
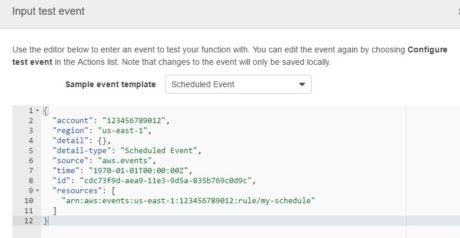 Once the function is created, it’s tested with a dummy event:
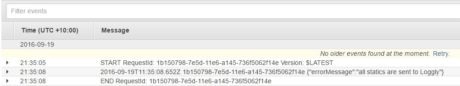 A successful setup should show the output in CloudWatch logs:
 And Loggly:
Scenario 1: EC2 Server Running Load Test
For our first test case, we have rolled out an m3.medium EC2 instance. The instance is running Ubuntu 14.04 and installed with stress-ng. Our goal is to run stress-ng and create an artificial load in this machine. This is similar to CPU overloading in a server which can be caused by any application, hardware, or network traffic. As the CPU usage grows, it will be evident from CloudWatch. The Lambda function will poll CloudWatch periodically and copy, among other metrics, CPUUtilization. In Loggly, we will be able to view the metric value and plot a trend from it. This is pure performance monitoring in Loggly without any log management involved.
Step 1. Installing and Running Stress-ng
Stress-ng is a load simulator available for the Ubuntu operating system. The utility has a wide variety of command line switches used for customizing the load. The installation is fairly simple as well:
# apt-get install stress-ng
More details about stress-ng can be found on the Ubuntu man page.
Once the tool is installed, it can be run as a command to simulate a CPU load with the following:
- 4 worker threads
- 80% load
- Timeout after 25 minutes (1,500 seconds)
# stress-ng --timeout 1500 --cpu 4 --cpu-load 80
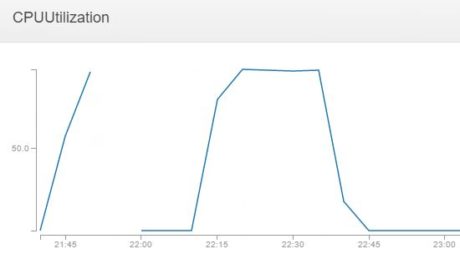 As the CPU becomes more and more loaded, the the CPUUtilization metric in CloudWatch also reflects it:
Step 2. Searching Loggly for Amazon CloudWatch Metric
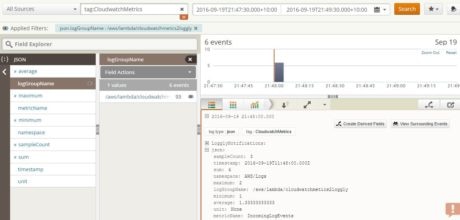
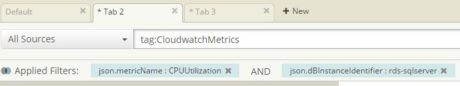
By now the Lambda function will be streaming Amazon CloudWatch metrics to Loggly every five minutes.  To see the data, we can create a search condition with “tag:CloudWatchMetrics” and select the CPUUtilization metric from Loggly Dynamic Field Explorer™ of JSON data:
The CPUUtilization metric shows a number of events. 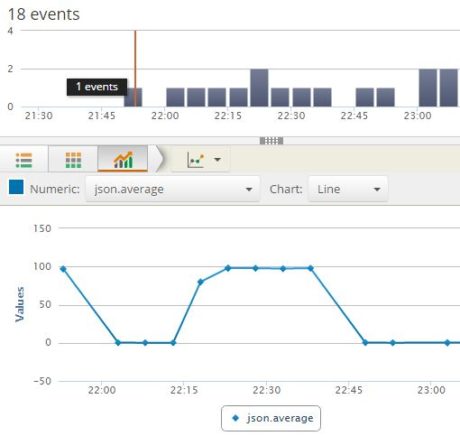 The following image shows the average CPU usage for last one hour as a timeline graph:
As we can see, the CPU usage rises from zero to 100 percent and then goes down to zero as the test completes.
Step 3. Creating a Dashboard
The trend graph is saved 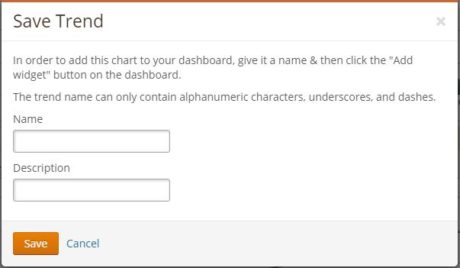 as a widget by clicking the “Add to Dashboard” button:
And the widget is added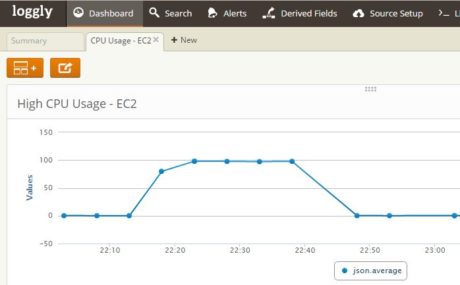 to a dashboard:
As you can see, the process is simple. With a little tweaking, we have turned Loggly into a basic performance monitoring solution.
You may wonder why would we want to do this, particularly when the same dashboard can be built in Amazon CloudWatch or Amazon CloudWatch logs can capture instance logs like Loggly. As we will see next, the real strength of Loggly is evident when we want to correlate performance data with other information.
Scenario 2: RDS Instance Running SQL Server
To further illustrate how we can capture Amazon CloudWatch metrics from non-EC2 resources, we have rolled out an m3.medium SQL Server 2012 instance in RDS.
We can run the following code snippet to create a high CPU load for 30 minutes (1,800 seconds). Since the Lambda function runs every five minutes, it gives us enough sample points to collect. The query itself is from Pinal Dave’s blog:
DECLARE @T DATETIME, @F BIGINT;
SET @T = GETDATE();
WHILE DATEADD(SECOND,1800,@T)>GETDATE()
SET @F=POWER(2,1800);
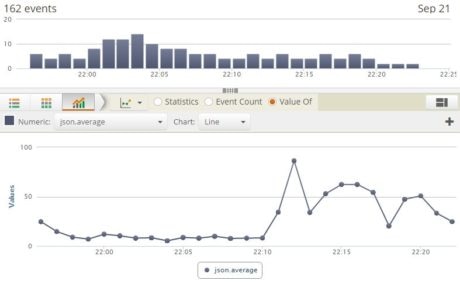
 The images below show how we are able to plot CPU utilization characteristics for the RDS instance:
Scenario 3: EC2 Server Running MySQL
This is the most common performance troubleshooting scenario. An application may be running slow due to a resource bottleneck in CPU, memory, or disk IO. The resource, in turn, could be held up by badly written application logic, a suboptimal database query, or simply a configuration parameter left with default value. Application logs can show the code being executed, but this is only half the story. The rest of the information can come from the actual performance profile of the server. Together, these two can paint a real picture of the system’s health and its underlying root cause.
In this use case we will configure MySQL 5.7 in an m3.medium EC2 instance running Ubuntu 14.04. We will restore a sample database in the instance and configure it to capture queries taking longer than say, five seconds. The slow query log will also be streamed into Loggly. We will then run MySQL’s built-in benchmarking tool called mysqlslap to load the server. This will increase the CPU utilization. This is similar to an application running slow due to a resource bottleneck caused by a badly written query. The CPUUtilization metric will be captured by the Lambda function and we will correlate it with the slow queries.
Step 1. Configuring MySQL for Slow Queries
In the following commands, we are creating a separate directory for MySQL logs and assigning read permission to it for everyone:
# mkdir -p /var/log/mysql/logs
# chown mysql:mysql /var/log/mysql/logs
Next, we have to add the following code block in the MySQL configuration file /etc/mysql/mysql.conf.d/mysqld.cnf. This ensures MySQL is logging both its queries to a general log file (mysql.log) and queries taking more that five seconds to a slow query log:
[mysqld]
pid-file = /var/run/mysqld/mysqld.pid
socket = /var/run/mysqld/mysqld.sock
datadir = /var/lib/mysql
log-error = /var/log/mysql/error.log
# Disabling symbolic-links is recommended to prevent assorted security risks
symbolic-links=0
general_log = 1
general_log_file = /var/log/mysql/mysql.log
log_output = FILE
slow_query_log = 1
slow_query_log_file = /var/log/mysql/mysql-slow.log
log_queries_not_using_indexes = 1
log_slow_admin_statements = 1
long_query_time = 5
min_examined_row_limit = 10
log_output = FILE
Once the file is saved, MySQL service is restarted:
# service mysql restart
Step 2. Importing Sample Data
A sample database dump is then restored. This sample database is called employees. This is a fictitious HR application with a few tables and a sizeable number of rows. The employees database is packaged with other well-known MySQL samples like Sakila, and it’s ideal for running tests like ours. The sample is available from GitHub repo of Giuseppe Maxia. The repo was originally located in Launchpad, but has been moved to GitHub.
The following commands show the dump file being restored in local MySQL:
# mysql -u root -p -t < employees.sql
Once restored, the database contents can be seen:
mysql> use employees;
Database changed
mysql> show tables;
+----------------------+
| Tables_in_employees |
+----------------------+
| current_dept_emp |
| departments |
| dept_emp |
| dept_emp_latest_date |
| dept_manager |
| employees |
| salaries |
| titles |
+----------------------+
8 rows in set (0.00 sec)
mysql> select count(*) from employees;
+----------+
| count(*) |
+----------+
| 300024 |
+----------+
1 row in set (0.10 sec)
To see if slow query log is working, the following command is run from the MySQL prompt:
mysql> use employees;
mysql> select
e.first_name, e.last_name,
d.dept_name,
cde.from_date,
cde.to_date
from employees e
inner join current_dept_emp cde
on e.emp_no =cde.emp_no
inner join departments d
on cde.dept_no = d.dept_no
order by e.last_name;
The last line of the returned result set shows the time taken:
300024 rows in set (6.82 sec)
Examining the slow query log also shows this:
# cat /var/log/mysql/mysql-slow.log
/usr/sbin/mysqld, Version: 5.7.14-log (MySQL Community Server (GPL)). started with:
Tcp port: 0 Unix socket: /var/run/mysqld/mysqld.sock
Time Id Command Argument
# Time: 2016-10-08T04:11:39.508281Z
# User@Host: root[root] @ localhost [] Id: 6
# Query_time: 6.810730 Lock_time: 0.000412 Rows_sent: 300024 Rows_examined: 2163326
Step 3. Configuring Loggly for MySQL Slow Query Log and General Log
We can follow the steps described in Loggly’s “Linux File Monitoring” section to configure the server to send MySQL slow query log and general log to Loggly. This involves downloading a custom shell script from Loggly and running it with our Loggly subdomain name, username, and password:
# curl -O https://www.loggly.com/install/configure-file-monitoring.sh
# chmod 755 /var/log/mysql/mysql-slow.log
# bash configure-file-monitoring.sh \
-a <subdomain name> \
-u <user name> \
-f /var/log/mysql/mysql-slow.log \
-tag mysql-slow-query \
-l mysql-slow-query
In this example, the -f switch is used to specify the name of the file we want to monitor. The -l switch is used to assign a meaningful alias to the file.
When successful, the output looks like this:
INFO: Downloading dependencies - configure-linux.sh
Loggly account or subdomain:
Username is set
File to monitor: /var/log/mysql/mysql-slow.log
File tag: mysql-slow-query
File alias: mysql-slow-query
Please enter Loggly Password:***********
INFO: Initiating configure Loggly for file monitoring.
INFO: Operating system is Ubuntu.
INFO: Checking if logs-01.loggly.com is reachable.
INFO: logs-01.loggly.com is reachable.
…
…
INFO: Logs successfully transferred to Loggly! You are now sending /var/log/mysql/mysql-slow.log logs to Loggly.
INFO: File logs successfully parsed in Loggly!
SUCCESS: Successfully configured to send /var/log/mysql/mysql-slow.log logs via Loggly.
Similarly, the general log is also configured for Loggly:
# bash configure-file-monitoring.sh \
-a <subdomain name> \
-u <user name> \
-f //var/log/mysql/mysql.log \
-tag mysql-general-log \
-l mysql-general-log
Since our instance is running in AWS, we have to open the following ports in its security group so syslog data can be streamed out:
- Port 514 (UDP/syslog)
- Port 6514 (TLS/syslog)
Step 4. Creating a Loggly Source Group
To help us capture the logs from the host, 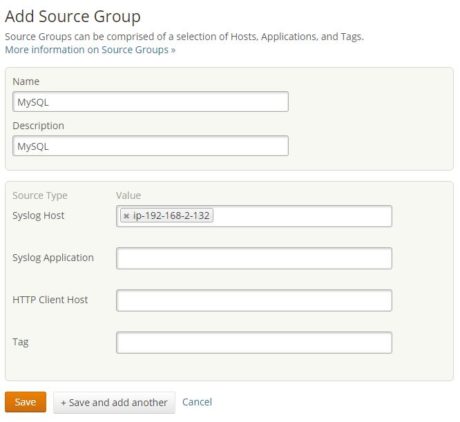 we can create a source group as shown below:
Step 5. Saving Loggly Search for MySQL Queries
Within a few minutes, the slow query log contents are visible from Loggly.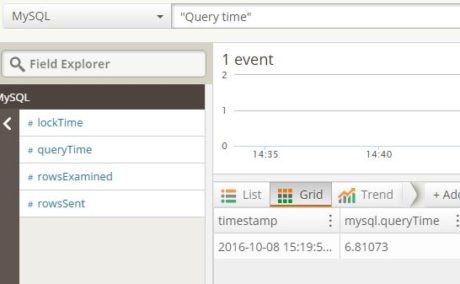 This shows the query we ran before:
Note that we have done two things to capture the log events:
- We selected the source group created for the MySQL instance
- We searched for the event text “Query time”
We can save this search for future use. In the image below, 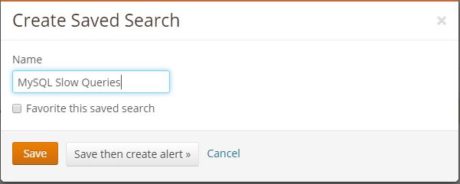 we are saving our search as “MySQL Slow Queries”:
Similarly, we can search for 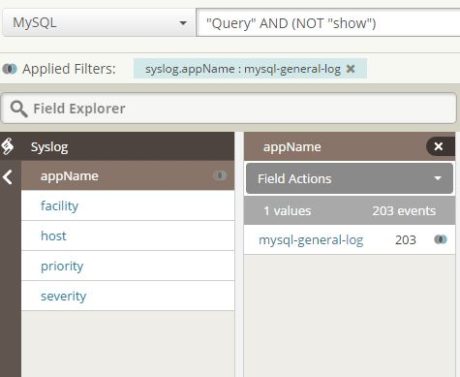 specific queries in the general log and save that search:
Step 6. Creating an Alert
Once the search screens are saved, we can create an alert on it. 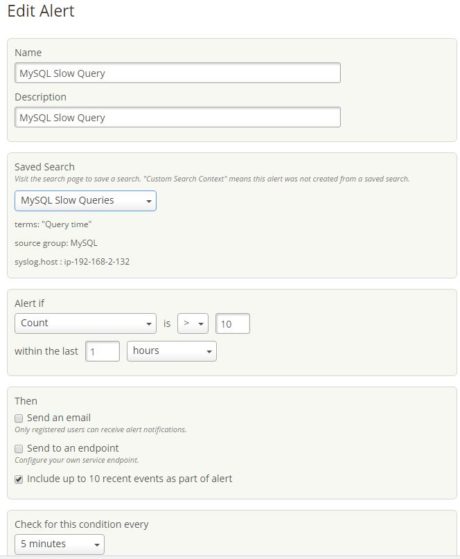 This is shown below:
Step 7. Load Testing with mysqlslap
Finally, the mysqlslap utility is started to simulate a stress test. Mysqlslap is a simple benchmarking tool that ships with MySQL. More about it can be learned here.
To simplify things, we can save the query in a text file under the root directory. The query in the file cannot have any line breaks or a semicolon at the end, so the content should look like this:
select e.first_name, e.last_name, d.dept_name, cde.from_date, cde.to_date from employees e inner join current_dept_emp cde on e.emp_no =cde.emp_no inner join departments d on cde.dept_no = d.dept_no order by e.last_name
Mysqlslap is then invoked, emulating 50 concurrent user connections each running the query 20 times:
mysqlslap --user=root --password --host=localhost --concurrency=50 --iterations=20 --create-schema=employees --query="/employee_query.sql" --verbose
There will be no immediate output, but when the process completes, messages like this are printed:
Benchmark
Average number of seconds to run all queries: 328.503 seconds
Minimum number of seconds to run all queries: 307.757 seconds
Maximum number of seconds to run all queries: 336.099 seconds
Number of clients running queries: 50
Average number of queries per client: 1
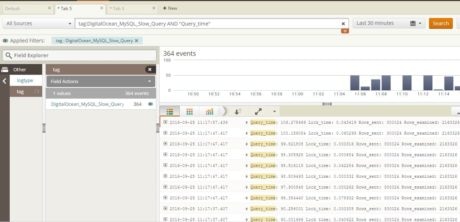
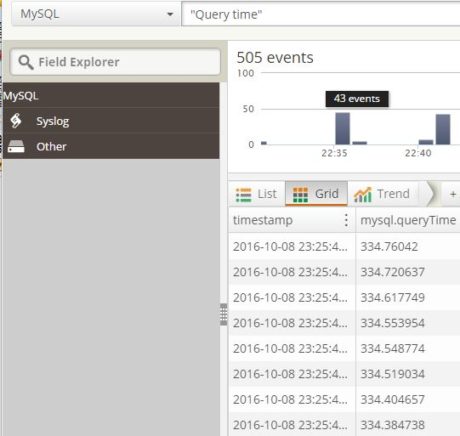 As the load testing continues, searching through Loggly for the slow query log shows queries taking far more than five seconds.
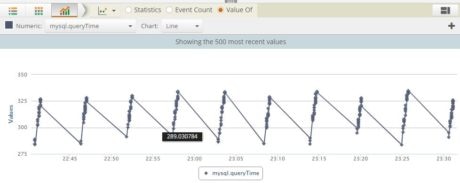 The recorded query time can be easily plotted as a line graph:
At the same time, the CPUUtilization metric from CloudWatch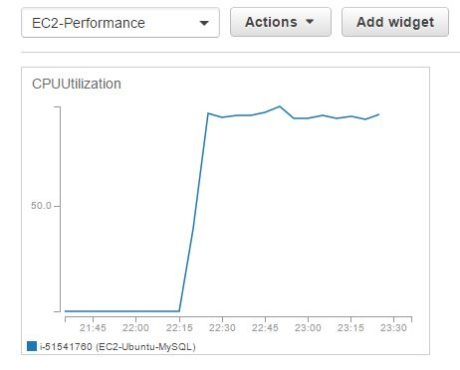 shows it has peaked to almost 100%:
If we search for the CPUUtilization metric in Loggly, 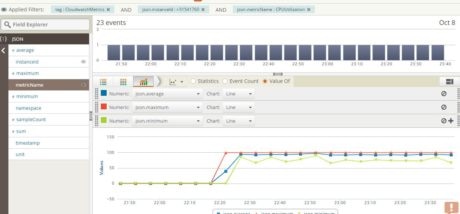 we see this graph:
Step 8. Creating a Dashboard
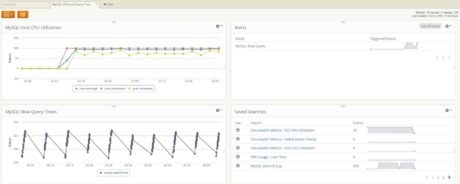 We can save some of these searches as dashboard widgets. In the following image, we have created a dashboard with the Amazon CloudWatch CPUUtilization metric and the slow query times graph derived from the MySQL slow query log. Correlating these two in a common point in time shows the CPU spike coinciding with high query time. We can also refer to the alert widget and see the “MySQL Slow Query” alert has been firing quite consistently.
Knowing that we may have the high CPU usage due to MySQL running a query slowly, 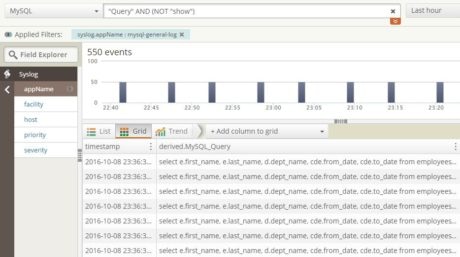 we can click the saved search for MySQL general log, which would show us the queries being executed:
Scenario 4: Non-AWS Hosted Server Running MySQL
In the final use case, we will not use Amazon CloudWatch metrics integration with Loggly. Instead, we will focus on how non-Amazon resources can use Loggly for performance monitoring. Although most Loggly customers are using AWS as their preferred hosting platform, there are companies that use other cloud providers or on-premise infrastructure. Companies in these categories can still consider Loggly as an effective log and performance monitoring solution.
For this exercise we will use a DigitalOcean Droplet with 4 GB RAM and 2 CPUs running 64 bit CentOS 7.2. We have installed MySQL 5.7 in the Droplet and just like in scenario 2, configured it to capture slow queries in a log file. Also the employees database backup has been restored in the instance. We will run the same query as before with mysqlslap. As the CPU usage increases in the machine, we will capture its usage pattern with a custom bash script and stream that to Loggly. Finally, we will create a CPU performance metric graph in Loggly using that information.
Step 1. Creating a Script and Cron Job to Capture CPU Usage
DigitalOcean does not have a comprehensive monitoring tool like CloudWatch,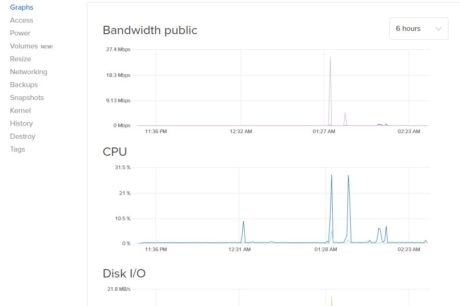 but there are graphs available for CPU, bandwidth, and Disk IO:
Our Lambda function can’t be used here because that can capture events from Amazon CloudWatch only; non-AWS hosted resources can’t connect to Amazon CloudWatch.
In this case we can use a shell script to measure CPU performance and log it in a local file. The file’s data can be streamed to Loggly because Loggly can monitor Linux files from any source. The script would be run from a scheduled cron job so the log file will have a list of CPU usage values.
We named our script as cpu_usage.sh and it’s saved under root directory. Here is its code:
#!/bin/sh
cpu_usage_line=$(/usr/bin/sar -u 1 1 | /bin/sed -n 4p)
timestamp=$(echo $cpu_usage_line | awk '{ print $1 " " $2}')
cpu_user_time=$(echo $cpu_usage_line | awk '{ print $4}')
echo "{ \"datetime\": \"$timestamp\", \"%cpu_user_time\": $cpu_user_time }"
This is a very simple script. It calls the sar command (part of sysstat package) and captures the current CPU usage. Next, it extracts the timestamp and % CPU user time from the raw data. Finally, a JSON document is constructed from these two values. When the script runs from cron, its output is written to a log file which then becomes input for Loggly.
In this case the cron job runs the script every two minutes and saves the result in cpu_usage.log file under /var/log directory:
*/2 * * * * bash /cpu_usage.sh >> /var/log/cpu_usage.log
A sample content from the cpu_usage log file is shown below:
{ "datetime": "01:50:02 PM", "%cpu_user_time": 0.00 }
{ "datetime": "01:52:02 PM", "%cpu_user_time": 0.00 }
{ "datetime": "01:54:02 PM", "%cpu_user_time": 60.00 }
{ "datetime": "01:56:02 PM", "%cpu_user_time": 42.73 }
{ "datetime": "01:58:02 PM", "%cpu_user_time": 31.72 }
{ "datetime": "02:00:02 PM", "%cpu_user_time": 21.00 }
{ "datetime": "02:02:02 PM", "%cpu_user_time": 59.02 }
{ "datetime": "02:04:02 PM", "%cpu_user_time": 0.00 }
{ "datetime": "02:06:02 PM", "%cpu_user_time": 0.00 }
Step 2. Configuring Loggly Integration for Custom Log File
We can follow the steps described in Loggly’s “Linux File Monitoring” section to configure the server to send the cpu_usage.log file to Loggly. Once the configuration completes successfully, we can search for a tag called “cpu_usage”. 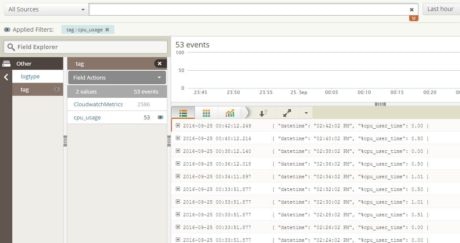 The image below shows the log contents:
Plotting the %cpu_user_time value from the log gives us a trendline graph.
As before, 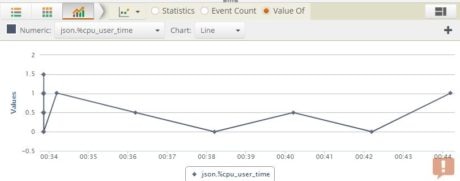 we can add this to a dashboard:
Step 3. Configuring Loggly Integration for Slow Query Log
Using the same procedure for capturing custom logs, we are able to send slow query log to Loggly. 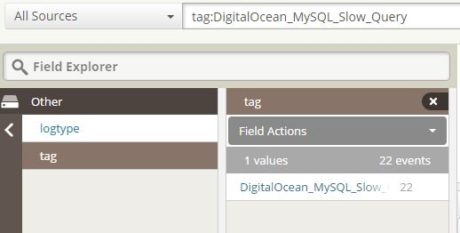 The following screen shows this:
Step 4. Load Testing with mysqlslap
With everything in place, we can run our test query with mysqlslap. This invariably pushes up the % 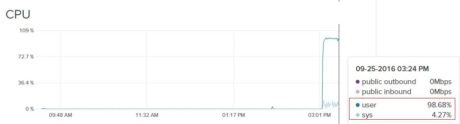 CPU user time as evident from the DigitalOcean Graphs Console:
 And MySQL slow query log in Loggly:
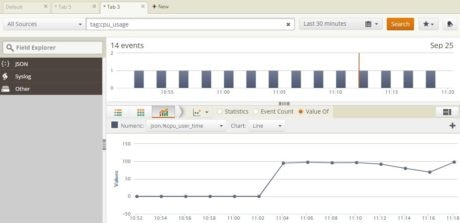 This can be verified by creating a trend line graph from the custom CPU usage log:
Step 5. Creating a Dashboard
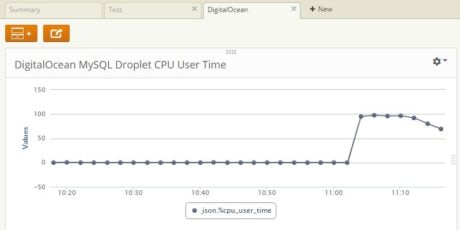 Finally we created a Loggly dashboard with the CPU usage graph:
Of course we could include MySQL general log and slow query log in the dashboard, but we have omitted this here for simplicity’s sake.
With a simple bash script and Loggly’s versatile log integration, we were able to ingest performance metrics from non-AWS resources and create meaningful visualization.
Installing Loggly Application Pack for CloudWatch Metrics
Loggly now offers a set of “one-click” application packs, including one for Amazon CloudWatch. These are available from the Source Setup screen’s sub-menu. Basically, an application pack creates a number of predefined saved searches and widgets for monitoring the application.
Application packs thus enable Loggly users to start analyzing data collected from any of these systems almost immediately. This saves the user from having to build a search from scratch. Also the widgets can be incorporated in new dashboards for visualizing system health in no time. You can read more in this post on the Loggly blog.
 As the image below shows, the CloudWatch Metrics app installs a number of searches and widgets:
Clicking the “Add Selected Items” button will install the selected items.
Conclusion
As we have now seen, Loggly has some very attractive performance monitoring features compared to Amazon CloudWatch. Having said that, Amazon CloudWatch as a technology is widely used by many AWS customers and there are many third-party tools that build on top of it. At the beginning of this article, we listed some of the differences between the two technologies. Perhaps the biggest differentiator is how they behave in response to alerts.
With Amazon CloudWatch, a metric alert can take five types of actions based on the resource:
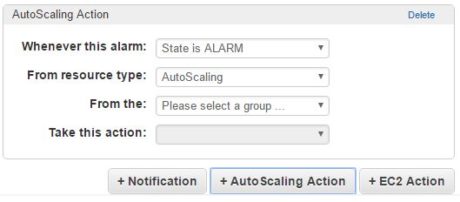 It can take an auto-scaling action where the number of instances are dynamically adjusted.
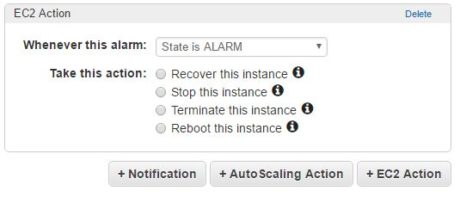 It can stop, terminate, recover, or reboot an instance.
These actions are not possible with Loggly.
And this is how it’s supposed to be, because Loggly as a monitoring tool captures logs–and now performance metrics–to provide a meaningful picture of a system’s health. Amazon CloudWatch’s strength comes from its ability to take actions based on a system’s performance.
In our opinion, therefore, both these tools should be used as complementary to each other.
The Loggly and SolarWinds trademarks, service marks, and logos are the exclusive property of SolarWinds Worldwide, LLC or its affiliates. All other trademarks are the property of their respective owners.

Sadequl Hussain