The Alchemy of Anomalies
“Learn to recognize omens, and follow them.”
In Paulo Coelho’s The Alchemist, the boy remembers what the old king said—to recognize omens. What I find fascinating is that the same principle can be applied to your logs. In the world of logs, however, you need to look for anomalies.
In general, an anomaly is something that is different from what you expect. For someone in San Francisco, a foggy start to the day would not be an anomaly. But if she were to see a huge colony of flamingos outside her home in the morning, that would be an anomaly.
When it comes to your daily operations, most web businesses expect a certain amount of errors, in some proportion to traffic. While you cannot prevent every single error, you can start learning how and when it happens, understand the underlying symptoms, and plan ahead.
Knowing the patterns in errors, you can choose how to respond to them. For example, you can scale up and down your compute resources on specific days of the month when transaction volume is higher than what is usually experienced.
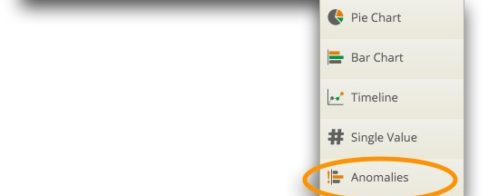
With the right context and tools, anomalies can shine light on interesting happenings in your system. Use Loggly Anomaly Detection to stay on top of such occurrences with minimal effort.
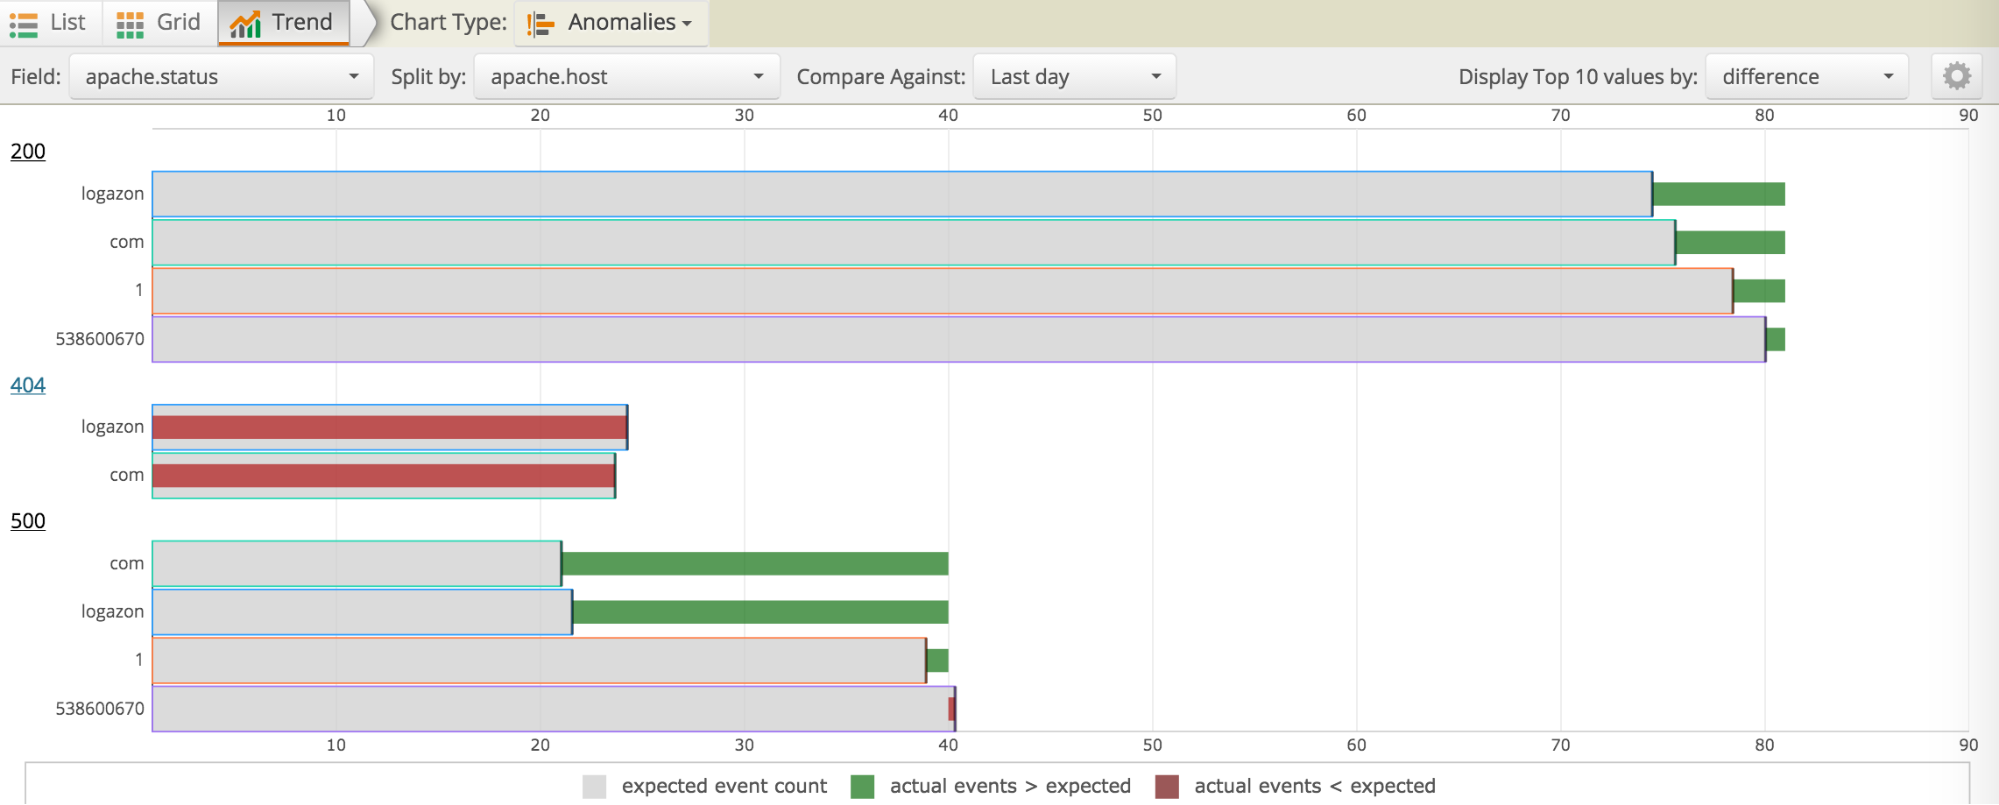
Our Anomaly Detection is unique because it can automatically detect changes in thousands or millions of values over time and gives you a summary trend graph or alerts whenever there are large unexpected changes. In the image shown below, you can easily search and check if 404 or 500 status errors have increased or decreased as a Percent Difference compared to the last day, allowing you to identify unusual behavior and act on it.
You can also proactively monitor such unusual behavior by setting up alerts. Below, I share a few ways in which some of Loggly’s customers are using Loggly Anomaly Detection together with alerts to adapt and manage their operations.
Identifying High Volume of Requests
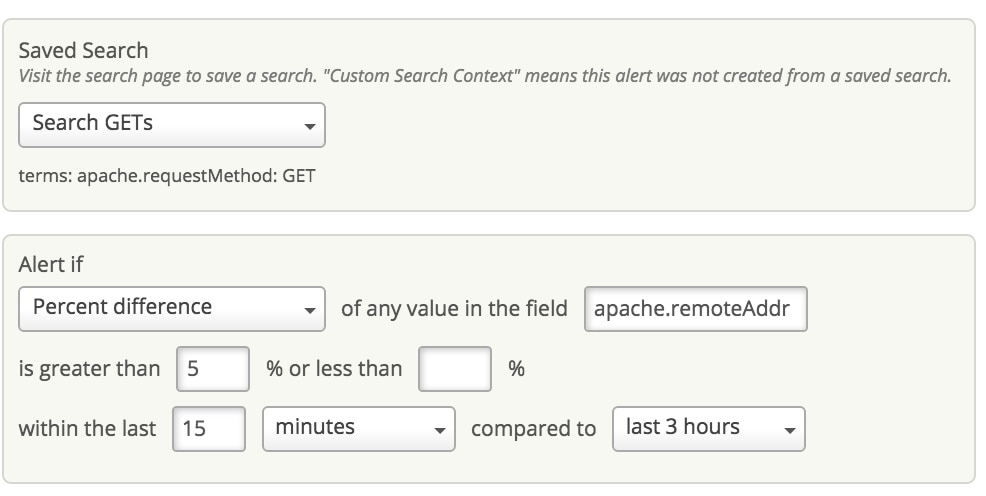
You can track the volume of requests on your web server and identify if any IPs are making too many requests. You could set up an alert in Loggly using simply Counts or Percent Difference options. Loggly will inform you right away when a higher number of requests is made to the server in a limited time interval from a particular IP. We automatically detect the IPs that have changes, as it would be impossible to set separate alerts for each IP address. You could set up different thresholds for different times of the week based on your traffic volume.
Detecting Server Errors
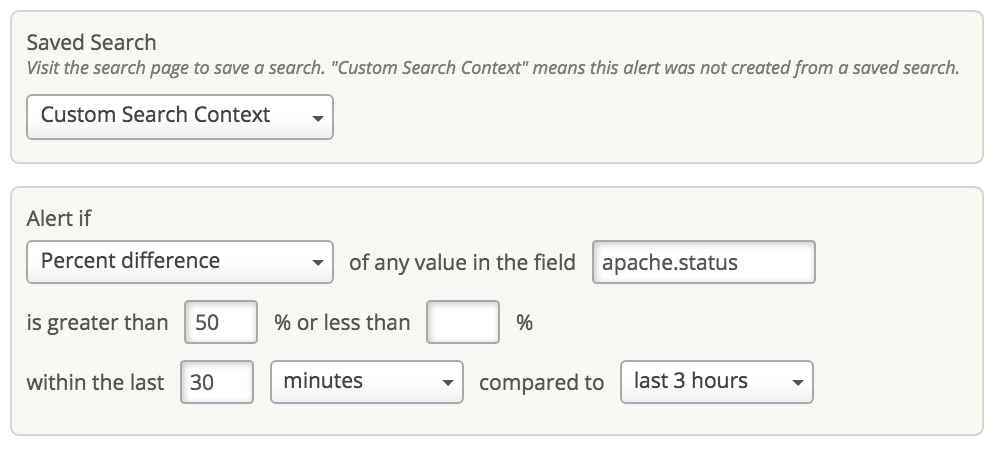
Internal Server Error–the dreaded HTTP 500–casts more shadows than it illuminates the underlying problem areas. It is a generic error message used whenever something goes wrong on the web server. One way to address it is to set an alert in Loggly to check whenever the count of Apache status 500 errors increase by, say, 50% in a short time interval. This would tell you something unusual is happening so you can act on it right away.
Monitoring Healthy Host Counts for ELB
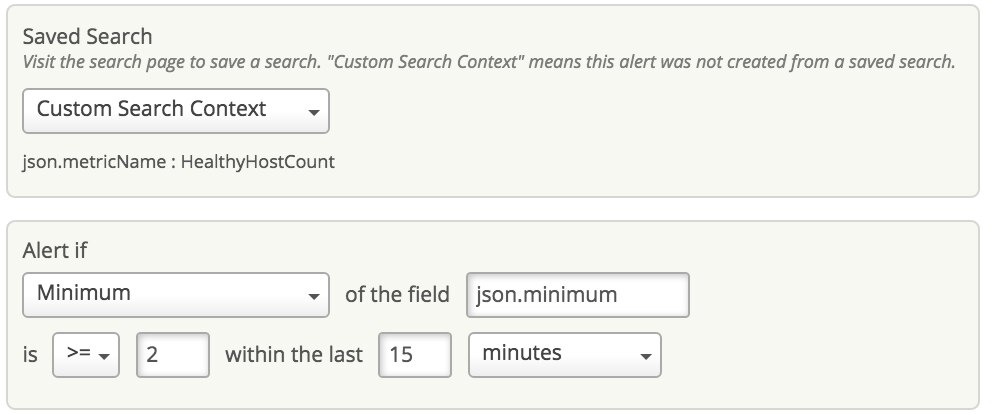
AWS customers use Elastic Load Balancing (ELB) to automatically distribute incoming application traffic across multiple Amazon EC2 instances. Say you want to ensure that the number of healthy Amazon EC2 instances behind an Elastic Load Balancer is never fewer than two. You can set up an alert to monitor this metric in Loggly using the Minimum operator and you will be notified right away if the count drops below two.
Monitoring Failed Login Attempts
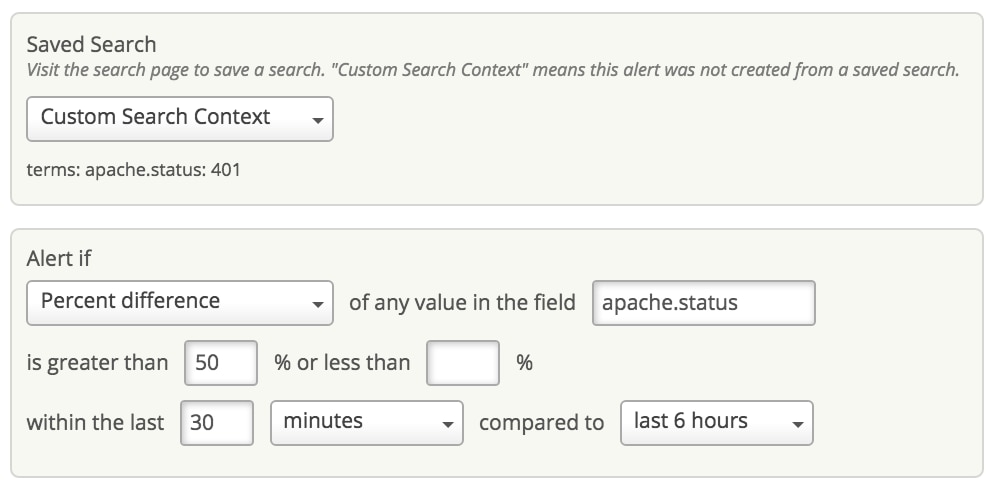
HTTP 401 errors happen when some visitor on your website (or malicious bot) attempts to access a page but is not authorized to do so. Bots usually manifest themselves as a spike in failed logins. You can set an alert in Loggly to inform you whenever the percentage of 401 errors in a rolling window of 30 minutes is exceeded by, say, 50% compared to the last 6 hours. This way, you will know if something or someone is actively trying to gain access to resources that they should not have.
Improving Customer Satisfaction
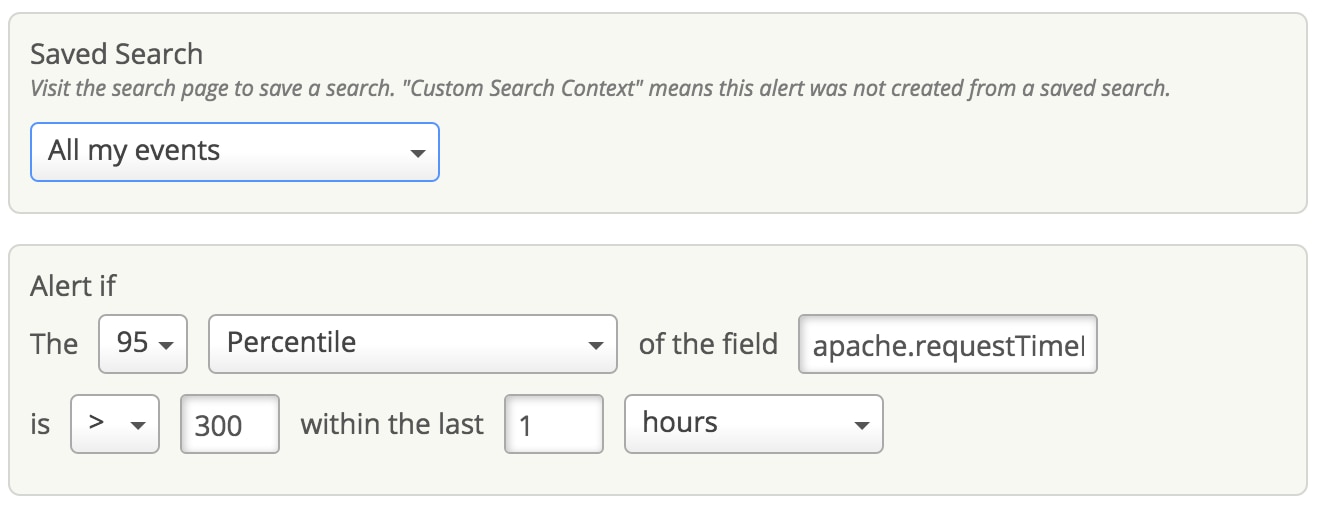
Instead of waiting for your customers to complain about sluggish response times on your website, you can be proactive and monitor deviations in Request Time. Stay alerted when requests are taking longer to process by creating an alert in Loggly. Loggly Dynamic Field Explorer™ makes it very easy to find the 95th Percentile values. Use the Percentile to specify what would be an unacceptable response time for your customers.

“There is only one way to learn,” the alchemist answered. “It’s through action.”
Become Your Own Anomaly Alchemist
Use Loggly alerts to surface anomalies in your system and get notified via email, Slack, HipChat, and PagerDuty. Alerts are available to customers in all paid tiers. Anomaly Detection is available in the Enterprise tier and as a 14-day trial for non-Enterprise customers. If you haven’t tried Loggly yet, you have one more reason to get started now!
The Loggly and SolarWinds trademarks, service marks, and logos are the exclusive property of SolarWinds Worldwide, LLC or its affiliates. All other trademarks are the property of their respective owners.

Pranay Kamat Pranay Kamat is Senior Product Manager at Loggly. His previous experiences include designing user interfaces, APIs, and data migration tools for Oracle and Accela. He has an MBA from The University of Texas at Austin and Master's degree in Computer Science from Cornell University.