Using Loggly to Run Trouble-Free Websites on Microsoft Azure
As any software provider can attest, “You’re only as good as your customers say you are.” To us operations folks, that means providing a rock solid infrastructure as the cornerstone of our CMS application. We were an early adopter of Loggly at Acumium, and we’ve found it to be an invaluable addition to our operations toolbox. We’ve used it a lot for access logs coming from common web servers that were being written to local server drives.
Our Move to Microsoft Azure: Less IaaS and More PaaS
Recently, we’ve started deploying some of our custom web applications into Azure Web Apps. This was an important transition for us because it enabled us to start using less IaaS and more PaaS. Effectively, we are able to spend less time standing up and maintaining operating systems and web servers, and more time on other things. At the same time, we reached a level of scalability and availability that we had more difficulty providing in the past.
One of the biggest benefits of Azure Web Apps is that you can scale your (normally static) .NET application horizontally, vertically, or both with the click of button. This means that we can change—on the fly—the amount of server resources (CPU and RAM) per instance that we want to allocate to our service plan, and we can change the number of server instances on which we want the application to run.
“Well that’s great. So what does all this have to do with Loggly?”
Centralized Logging Is Crucial for Auto Scaling Applications
Luckily for us, we can set up logging at the application level. No matter how much we scale up or down, regardless of the number or size of instances that are backing our application, the important access and application logs get delivered to a central location. Better yet, we can make that private blob storage on Azure. It’s all point-and-click stuff within Azure, so simple (and fast…by that I mean we have up-to-the-minute logs available).
… But Analysis Capabilities Are Where the Rubber Hits the Road
Well, everyone knows that centralized logging is great. But when you need to find something in that mountain of logs, you better have some pretty good sed, grep, and awk skills to find what you’re looking for. Even when you find that one event, how do you easily correlate it to other events? You need a good tool set to help you index, sort, analyze, present, and even alert on the interesting log data. That’s where Loggly comes in.
How to Send Microsoft Azure Logs to Loggly
We needed a way to get all of these access logs over to Loggly so they can work their magic.
In our case, we were already maintaining an Azure virtual machine, so we decided to use the idle cycles of that machine to pull down and deliver all of our Azure Web App logs over to Loggly. We have a pretty rudimentary Powershell script that accesses the container on the Azure blob storage and pulls down the recent logs to the virtual machine.
We were already running NxLog on that virtual machine to send some other logs, so we just added the new log directory to the NxLog conf file. The NxLog configuration we use is already formatting incoming logs to JSON before sending them to Loggly so Loggly can parse them. Here are the interesting parts of the NxLog configuration:
With this configuration, we have almost instantaneous fully indexed and searchable access logs from Azure Web Apps. In its simplest form, this log centralization gives us insight into the general health of our application based on status codes. We can also be certain that we are getting decent front-end response times by watching our time-taken thresholds.
How We Monitor Our Azure-Based Applications
If you have Loggly, setting up a couple of dashboards and alerts keeps you ahead of the game the next time your devs test their code in production! Here are a few of the items we like to keep an eye on.
Trend Graphs
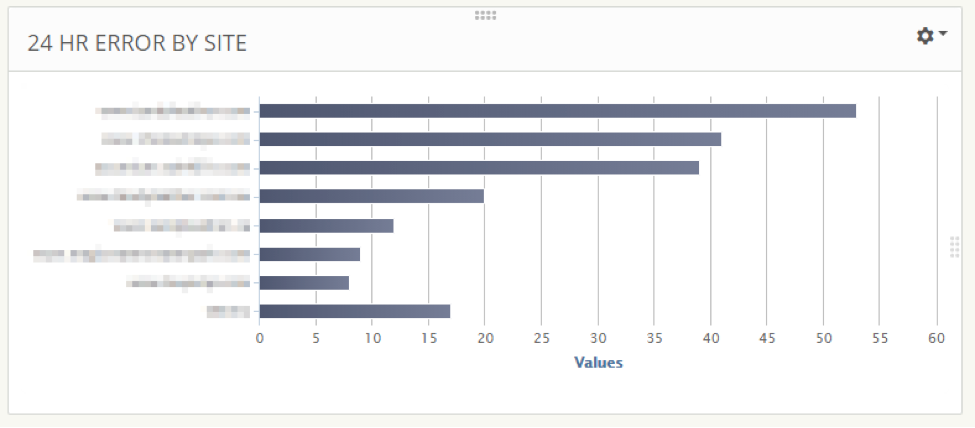
This trend graph allows us to quickly see which sites have been reporting errors. It’s based on a simple saved search “json.sc-status:500” and split by json.cs-host.
Alongside the errors graph, we keep an overview of total events per web application. This is just a split of all events by json.cs-host.

Here, we have a dashboard trend graph that is showing sites that have application transaction time (time-taken) exceeding 3 seconds over the last hour.

The great thing about all of these graphs is that you can click on the interesting stat and you’ll be taken to the Search dashboard so you can see the actual events that contributed to this count. Take that last trend graph: I just need to click on the bar I’m interested in and I’ll get moved over to the Search tab, with all my filters already applied.
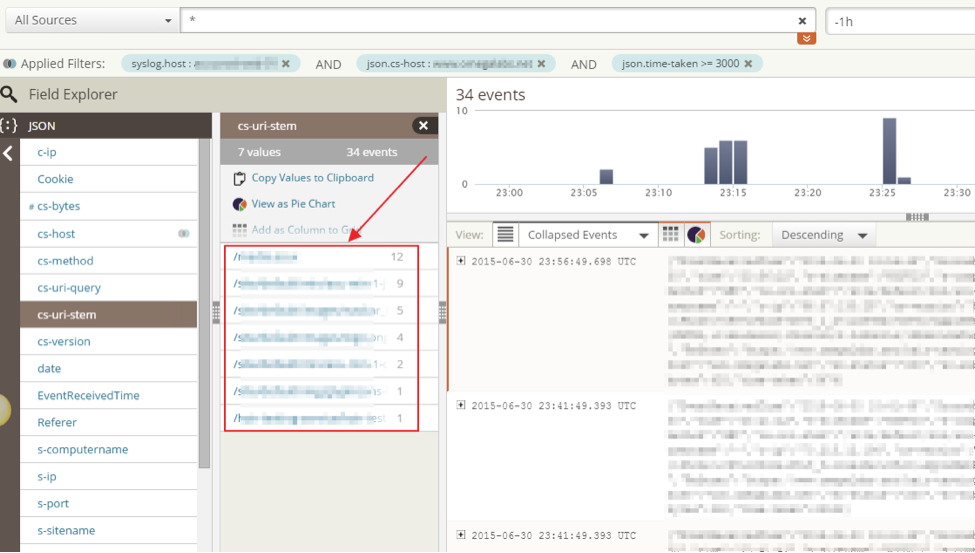
Now I can look through my JSON fields to find “cs-uri-stem” and identify the requests that need some attention. That top request is an image handler. Well, that’s not good; why is that so slow? On a hunch I checked on the User-Agent JSON field.
Guess what? They all have iPhone UA signatures. These requests are most likely coming from a slow phone data connection and the actual delivery of the image content is just slow. Mystery solved. I didn’t have to spend hours correlating these slow events to each other and trying to find a common denominator. It was very easy for me to narrow down the interesting events quickly with Loggly and make a pretty informed decision that this event was not an actionable problem.
Alerts
Any of these searches can be used to create alerts as well. We’ve set up a couple alerts that use our json.sc-status field values. For example, we want to know when we see more than an acceptable number of 404 or 500 statuses. Since we already use PagerDuty for our on-call rotations, we use Loggly’s integration to send alerts to the appropriate PagerDuty service.
About Me
Jason is the director of IT at Acumium. When he’s not ankle deep (the bad way) in operations, he dabbles dangerously over his head in application infrastructure architecture, server infrastructure and management, customer service management, web services, ESP management, and IT management and services.
The Loggly and SolarWinds trademarks, service marks, and logos are the exclusive property of SolarWinds Worldwide, LLC or its affiliates. All other trademarks are the property of their respective owners.

Jason Sajdak