9 strategies for faster live debug

Debugging a live application can be a real pain, especially if you’re running a microservices architecture with elastic servers or, in the case of Cardinal Peak, software and hardware solutions for a variety of remote and custom devices. In this post, I describe approaches to extracting useful insights out of your Loggly account. Most examples are written standalone, but throughout I’ll reference “the bug we’re trying to find” as incentive for you to look more deeply. So here are nine strategies for faster debugging, including basic search strategies, as well as more elegant techniques that are possible if you log in JSON.
Basic Search Strategies
Strategy #1: Put your focus on a specific time slice.
One of the most important factors of a log event is the time it occurred. Log events very rarely occur at the same recorded instant, so knowing the time tells you the statement. Perhaps even more importantly, the proximity in time between two log statements strongly predicts their relationship.
You can enter a datetime-like value into the time fields, or select from the calendar in Loggly search.
Substrings of a valid datetime formatted string are accepted, like 2016-10-26 and 2016-10-26T08:00:00. Additionally, certain shorthand strings are available, such as %s, %m, %h, %d, and %w where % is an integer. They are not composable.
Here are some common scenarios:
“We know the event happened two days ago.”
“This bug just occurred on my machine,” or “I’m reproducing the bug now.”
If you’re working with a remote system, you can use {-1m, now} to watch real-time logs scroll by with some latency. You have to manually refresh the search every minute or so. Loggly also provides Live Tail which gives you real-time response. Great technology!
Strategy #2: Search for specific known strings.
The string field is the most obvious way to search. Use it like a net and gain information on any other field quickly. If you know the `device_id` of a particular device you’re trying to debug, use basic string search to find the correct JSON pattern, then select from there. (See Using JSON to Identify Patterns and Errors below.) Or, you might search on a customer ID.
Strategy #3: View surrounding events.
Once you’ve found the log event you want, it is usually mixed up with all of the other similar events that satisfied your search. These events are not necessarily relevant. They are usually just copies of the same event you want from different instances. Click View Surrounding Events to see a small time slice directly around your target log event.
When you’re a beginner, Loggly seems to have failed. View Surrounding Events has now removed your filters and search results. Now add and modify your terms from the previous search to bring you the exact context you need for the target log statement. If you don’t do this, your target statement is nestled amidst potentially thousands of out-of-context logs and logs from other sources. Loggly has informed me that an upcoming, updated interface will correct this particular issue.
Strategy #4: Identify relationships.
Once you’ve found the log event that declares the bug you’re working on, your search should lead you back in time toward the root cause of the event. If you’ve followed at least some of the strategies from my post on How to Write Effective Logs for Remote Logging, you use the techniques below to narrow your search. The correctly phrased search and time slice is the entire lifecycle of the bug you’re trying to fix.
Using JSON to Identify Patterns and Errors
The true power of Loggly emerges when you start recording all of your data in a JSON format. Real-time key-value indexing is a feature of certain noSQL databases, and it provides a tremendous amount of power, especially using MapReduce. Because you have used JSON to structure your log data, you now have insight into it—all of it.
When it comes to structured logs, Loggly Dynamic Field Explorer™ gives you the most power. From here, you can compose statements about any indexed field, constructing queries as powerful as precomputed views on the fly with a much simpler syntax.

Strategy #5: Isolate a specific server or device.
Use Loggly Dynamic Field Explorer™ to pick the device you want from a list and to easily see usage information across devices. For example, you might have logged remoteAddr from Apache.
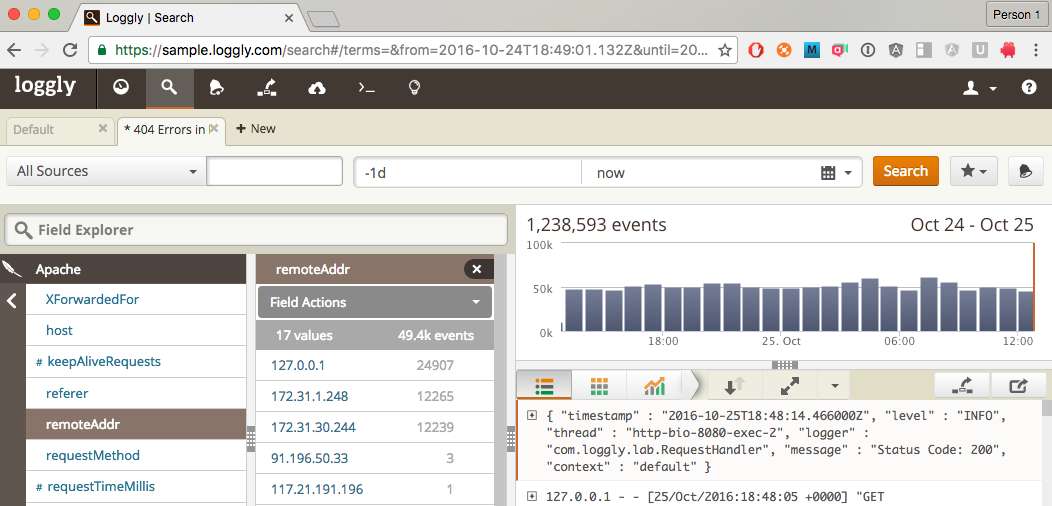
Clicking 172.31.1.248 begins an index search, reducing your data only to those that satisfy the expression.

These filters can be combined as far as you care to. I have built searches with five or six expressions. Importantly, note that if you click the ![]() from here, the number of log source options has been greatly reduced to reflect your own log universe. Loggly always updates Loggly Dynamic Field Explorer™ to reflect the current set of log results. Reducing your expressions this way is very easy. Remember that you have to clear all filters and search results before you can find more general data again. Or, save your search and press + New to start a fresh search on the global dataset.
from here, the number of log source options has been greatly reduced to reflect your own log universe. Loggly always updates Loggly Dynamic Field Explorer™ to reflect the current set of log results. Reducing your expressions this way is very easy. Remember that you have to clear all filters and search results before you can find more general data again. Or, save your search and press + New to start a fresh search on the global dataset.
Strategy #6: Search a specific version number.
Now that we have only requests from 172.31.1.248, we can find a version number for it:

Unsurprisingly, the bug we want is in curl/7.35.0. If we knew the target platform was Mozilla/5.0 … Trident/6.0 then we’d be done looking for that specific device and could broaden our search to all of its specific activity.
Strategy #7: Find a specific state.
You can add as many fields as you want in this fashion. Loggly also shows the number of occurrences of each event. By paying attention to them you can more easily do “data forensics” where you are able to find very elusive bugs by casually looking through log data.
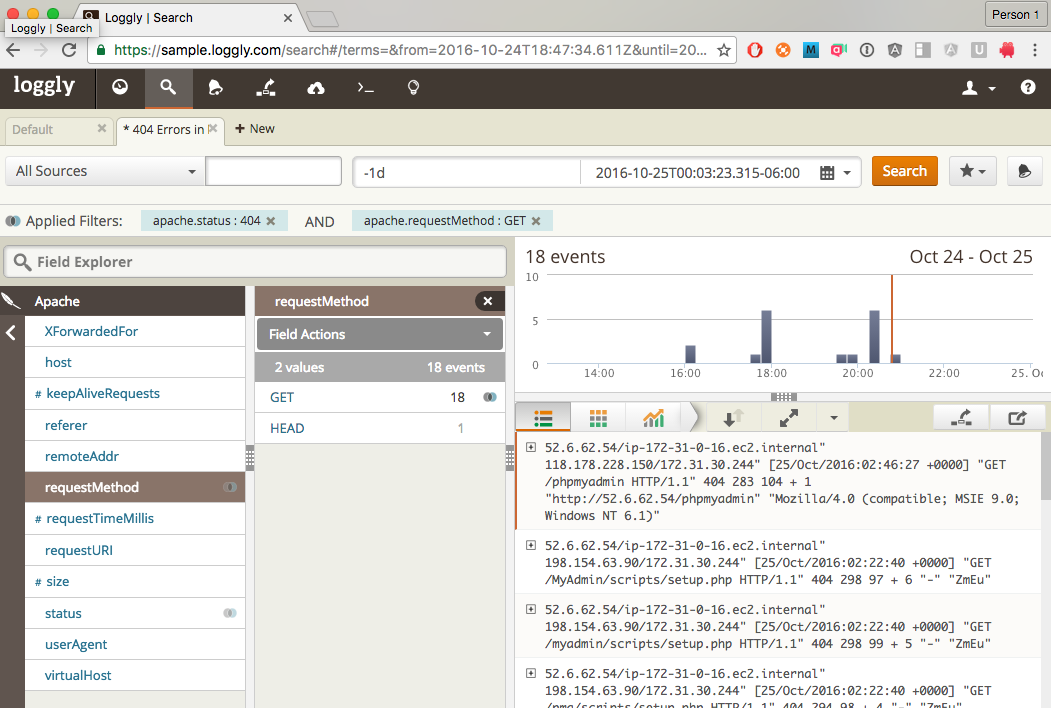
In the above, we see a quick way to target a 404 response to a GET request. Instead of narrowing our results search by search, now we can just peruse the 18 responses and pick the one we want. If you use the metadata approaches I describe in my previous post, you can easily get other relevant properties from that easy-to-find log message.
As you can see, there are many more ways to build data views using the Loggly Dynamic Field Explorer™. You decide what the most salient information is and begin your searches there. Often one or two queries bring you exactly to your target.
Strategy #8: Use saved searches to get your team on the same page.
An overlooked gem of Loggly is that a saved search is shared with all users of the account. This makes communicating about your results easy. Instead of describing what you’ve done, share it. You can also share a permalink for any search. Or, with the JIRA integration available to Enterprise customers, you can automatically incorporate log events into a new JIRA ticket.
Strategy #9: Monitor errors (but don’t obsess over them).
Loggly also helps with keeping your logs and codebase clean. It is easy to set up an error monitor with a saved search. Each time you view your Dashboard you can see if any unreported, lingering errors occur.
This is also a place of terrible rabbit holing, so use your time wisely. Determine first if you can easily solve an error that appears in a saved search. If not, it is usually better to report the error and resolve it through a normal work cycle. Investigate if the error has been reported by others, who reported it, and how frequently it occurs. Teach your managers to use Loggly Dynamic Field Explorer to triage issues on their own. Use your judgement, but given a little bit of time you can expect to have clean error monitoring. At this point error monitoring lets you fix issues before they’re even reported.
The Loggly and SolarWinds trademarks, service marks, and logos are the exclusive property of SolarWinds Worldwide, LLC or its affiliates. All other trademarks are the property of their respective owners.

Thomson Comer