Boss-Level Log Management for WordPress Site Administrators
With Loggly
WordPress is the most dominant content management system (CMS) in the enterprise website market today. Its open-source nature, thousands of plugins, and wide adoption by commercial hosting providers have bolstered its success. In addition, it’s highly compatible with other website technologies like web servers, database servers, or middleware. However, WordPress sites can also encounter hard-to-anticipate performance problems, errors introduced by untested plugins, or cyberattacks by malicious actors. Addressing these issues requires administrators to continuously monitor their WordPress deployments and depend on alerts when things go wrong.
The most common way to monitor any software solution is by looking at its logs—which usually contain detailed descriptions of every event. Yet, by and large, WordPress doesn’t generate its own logs. Of course, there are underlying logs (like error.log and access.log from the web server, and the general auth.log from Linux systems), but those log files can be hard to read. For serious deployments, these logs probably won’t give you the critical information needed for troubleshooting an issue with a WordPress site. The task of manually monitoring, accessing, searching, and correlating events from gigabytes of log data across multiple WordPress sites can be a daunting endeavor.
Luckily, there’s SolarWinds® Loggly®, a powerful log management tool. Loggly can help you centrally monitor WordPress logs and alert you when something isn’t right. In this post, we’ll use Loggly to capture logs from multiple WordPress installations, and then use the automated features in Loggly to troubleshoot problems.
Why Monitor WordPress Deployments?
For some developers, monitoring is an afterthought; it’s “nice to have” if they can ever get around to it. For others, monitoring is an assumed necessity but without a lot of consideration of the reasons why. For WordPress deployments, monitoring is primarily for security and performance.
Security
You can use the error and access logs of the web server to find web server-related issues. Sometimes, however, traditional system logging isn’t sufficient to help identify indicators of a cyberattack. Some of the biggest WordPress attack vectors include:
- Installation of unsafe WordPress plugins
- Unauthorized login attempts to the WordPress admin dashboard
- Unauthorized user account privilege elevation
- Manipulation of existing pages and posts
- Unauthorized creation of new pages and posts
- Unauthorized manipulation of site comments features
- Unauthorized SSH access attempts
All those events should leave an evidence trail, but only if the evidence is recorded somewhere. Moreover, the evidence is only useful if it’s reviewed.
Performance and Resiliency
Beyond security, analyzing data-rich logs is critical for understanding a website’s overall health. Visually scanning thousands of lines of a Linux syslog is challenging. Even if you’re up for the task, you may not be able to pick out the subtle trends. For example, how can you be sure the increasing incidents of long page load times or media access errors are pointing to something deeper? What about the few worrying errors and conditions spread here and there across your WordPress site? Are they one-offs, or are they evidence of a small issue that should be dealt with before it grows into a real problem? Surfacing these performance trends and early indicators is challenging and time-consuming, especially if it’s done manually.
An advanced log-management solution for monitoring your WordPress fleet can help. Proactive log monitoring can provide several benefits like:
- Easy anomaly and error detection
- Correlation of events from multiple log sources
- Trend analysis over time
- Event comparison between two different time frames
- Ability to drill down to event components
- Powerful, repeatable search capabilities
- Alerting
Introducing the WordPress Activity Log Plugin
Since most custom interactions with WordPress require a plugin, log management is no different. The popular WordPress Activity Log plugin from Melapress allows you to capture logs from your WordPress installation and stream them to a log-management solution. Looking at the available tabs in the figure below shows you how many categories of events are included:
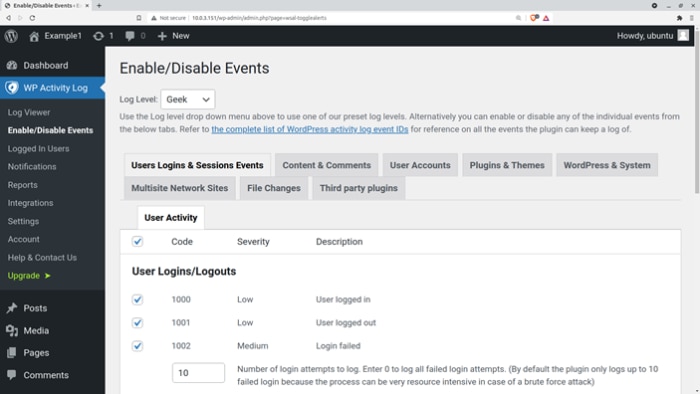
You can see the complete list of categories here.
The plugin’s Activity Log Viewer is available within the WordPress administration site. As you can see, there are some basic features for searching and filtering:
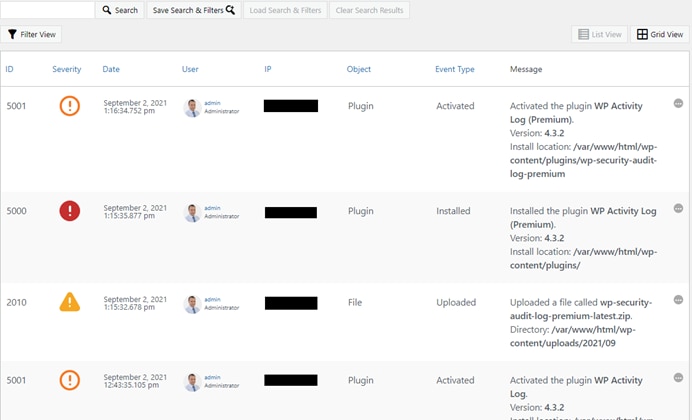
The fields of the logged events include:
- Event ID
- Severity level
- Timestamp
- User account
- IP address
- Object name
- Type
- Detailed message
However, the plugin is primarily designed to work with a single site. To ensure we can capture all the logs from multiple WordPress sites, we can use it in conjunction with SolarWinds Loggly—and this is where it shines.
Introducing SolarWinds Loggly
Loggly is a tool for collecting, managing, displaying, and analyzing logs from a wide variety of sources.
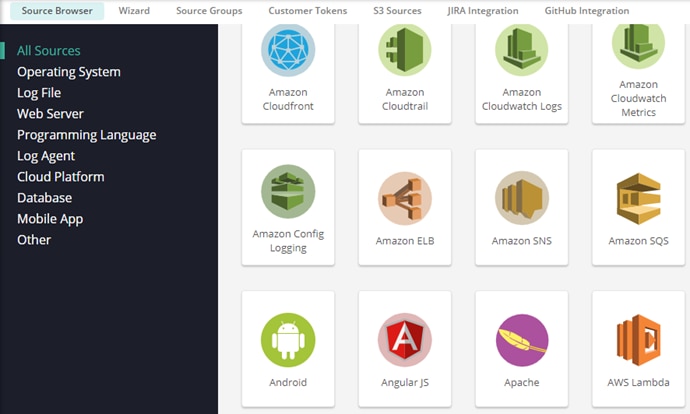
You can view log messages generated by any of your monitored resources from the Loggly browser interface.
Given the volume of data generated by modern servers, effective analysis of logs ultimately depends on the ability to filter and visualize log messages. You must be able to use search operators to select the specific data you’re after and visualize the log data through trend graphs, charts, and dashboards.
Through its full-featured interface and, in particular, the Dynamic Field Explorer™, Loggly lets you drill down into the event data and retrieve important individual log events. The built-in charting facility in Loggly allows you to display trends—all from the same page.
Installing and Configuring the WordPress Activity Log Plugin With Loggly
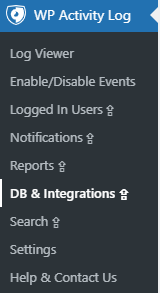
The WP Activity Log plugin can be installed from the New Plugins page of the WordPress administration site, just like any other plugin. Once you activate it, you can take a few moments to play around with the core features available. When you’re ready to take it to the next level, you can click the DB & Integrations option in the WP Activity Log menu.
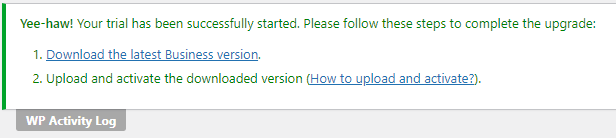
There, you can either purchase or opt for a 14-day free trial of the Business version. Once you’ve signed up, you’ll see the following message:
You need to save the zip-archived package to your local workstation and then upload it from the Add Plugins screen.
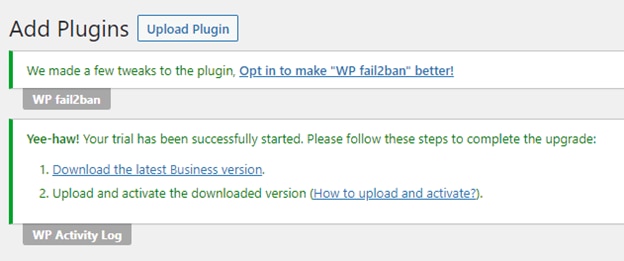
Once the package is uploaded, you need to activate it, completing the installation process for the plugin.
Next, to start streaming the WordPress logs to Loggly, you need to have a Loggly account. Like the WP Activity Log Plugin, Loggly also allows you to sign up for a free, limited-time trial.
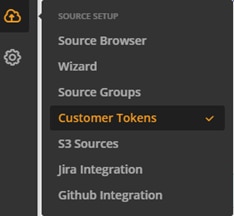
Once you’ve signed up with Loggly, create a Loggly customer token. Click the Set up Log Source button on the Loggly home page and then select the Customer Tokens tab. From there, you can either copy your existing active customer token or click Add New to create a new token.

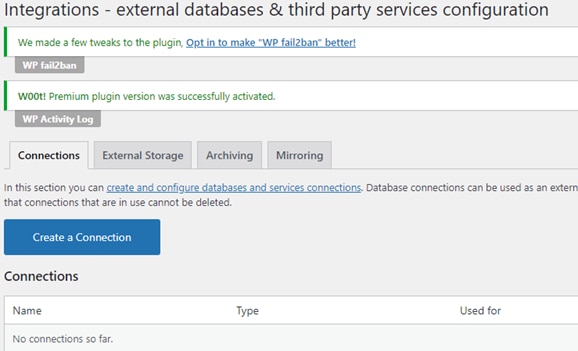
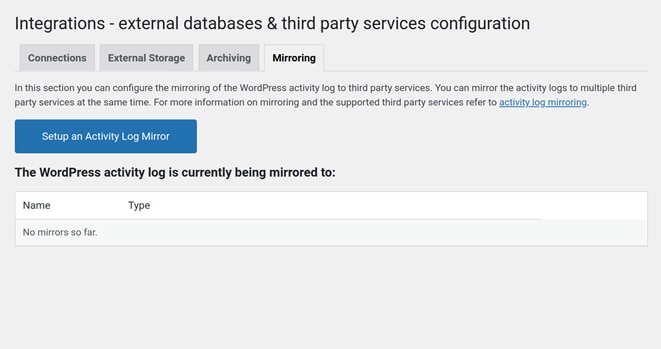
Back in the WordPress dashboard, click the WP Activity Log item from the navigation menu, and then Integrations. With the Connections tab selected, click Create a Connection.
You’ll see a wizard like the one shown below.
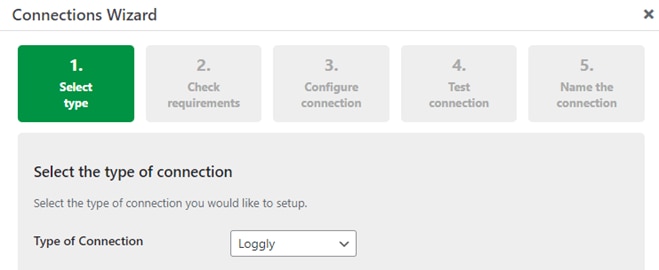
Select Loggly as the “Type of Connection,” and then click Next. If there are any underlying server configurations or dependencies missing, you’ll be shown details in the “Check Requirements” step. If all requirements are met, you’ll be all set to configure the connection you’ve selected.
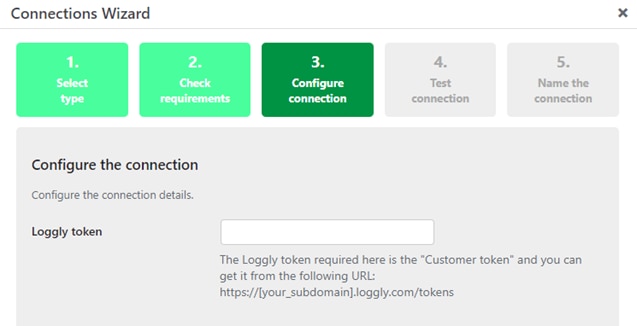
Provide your Loggly customer token. After this, the connection wizard will test the connection and ask you to name it.
With this done, your plugin should be able to communicate with your Loggly account. However, your logs won’t yet be sent over to Loggly until you set up Mirroring.
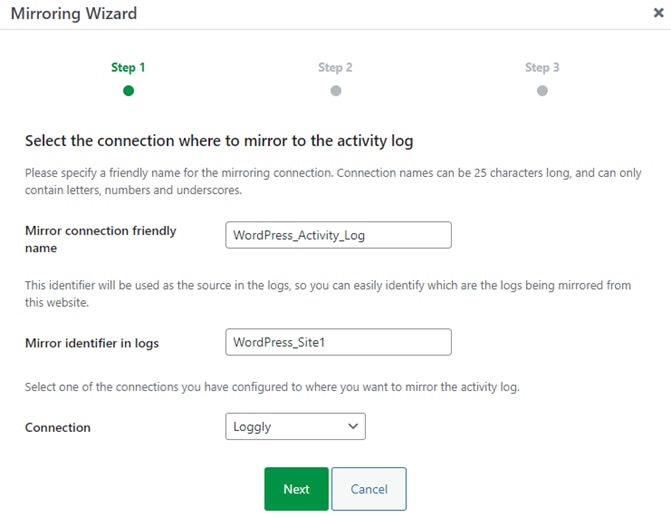
Step one of the Mirroring Wizard will ask you for a descriptive name for your mirror connection and a text string that’ll be appended to the log entries sent to Loggly. You should choose something that’ll make it obvious which node a log is coming from. You’ll also be asked to select a connection, which should be the one you just created.
Click Next, and then check the Start once configured checkbox. This will tell the plugin to start transferring WordPress logs to Loggly immediately.
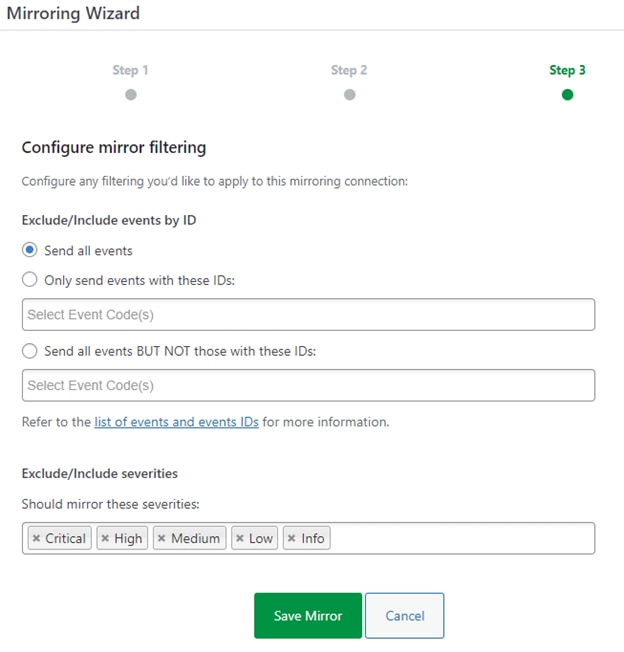
Finally, you can create filters to limit the log events sent to Loggly. For example, you can narrow down the flow by severity (i.e., Critical, High, Medium, Low, or Info). In our example, we’ll transfer all logs for our single WordPress site.
Once it’s done, save the mirror. Logs will start showing up in your Loggly account shortly. However, if you’ve waited for some time and you still can’t see the log events from your WordPress site, make sure they’re not being filtered out. Remove any overly restrictive search filters in the Search bar or change the time range.
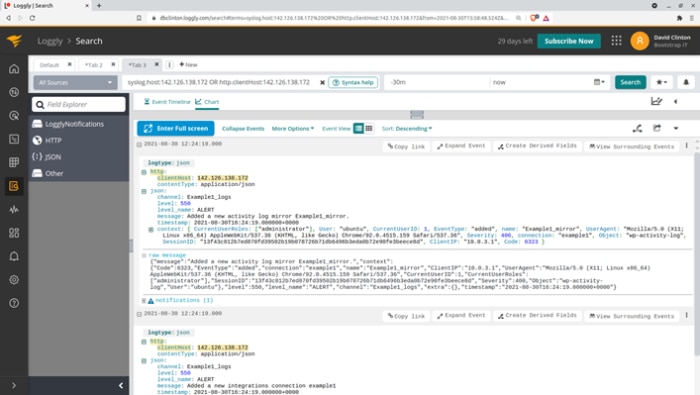
A Loggly Interface Walkthrough
The Log Explorer page in Loggly is typically broken down into three horizontal sections. The image below shows the log window taking up most of the available space, but this can change depending on how you use Loggly.
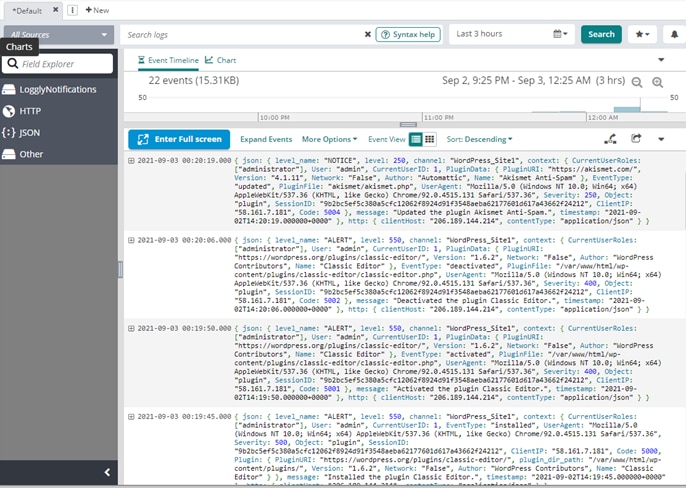
From here, you can expand or collapse the logged events. The image below shows an event in expanded form.

You can narrow down the output by text strings or by more sophisticated filters like tags, field values, or regular expressions. You do this by entering strings in the Search logs field. Also, you can access syntax help any time by clicking on the Syntax Help button.
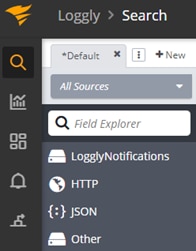
The Field Explorer box on the left allows you to filter for only carefully defined fields. You can type into the search box to find only the fields that match the search expression. You can also expand the top-level field classifications to drill down further.
A Practical Use Case
To see how this setup works, we performed some typical actions in our WordPress account, including:
- Adding a new user with an Author role
- Changing the role of the newly added user from Author to Editor
- Simulating some failed login attempts
- Creating a new blog post
- Editing an existing post
- Adding comments to a post
- Removing one of the newly added comments
- Installing a new plugin
- Deactivating an existing plugin
All these activities would be perfectly legitimate for an authorized user but should raise red flags for an unauthorized user. When you’re not expecting changes, log events for such activities can mean there’s something suspicious going on. In our use case, for example, let’s check all the failed login attempts to our WordPress admin site.
After making all the changes listed above, we open Loggly in a new browser tab and navigate to the Log Explorer page. From the Field Explorer, we select JSON. This opens a new drill-down in the view, where we select context and then EventType. From the list of event types, we select failed-login.
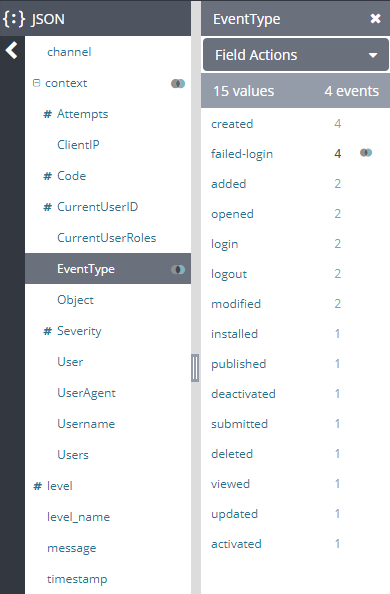
Loggly shows four events. Looking at the logs quickly confirms there have been some brute-force style login attempts.

We can also create a visualization from the failed login events and save it as a chart.
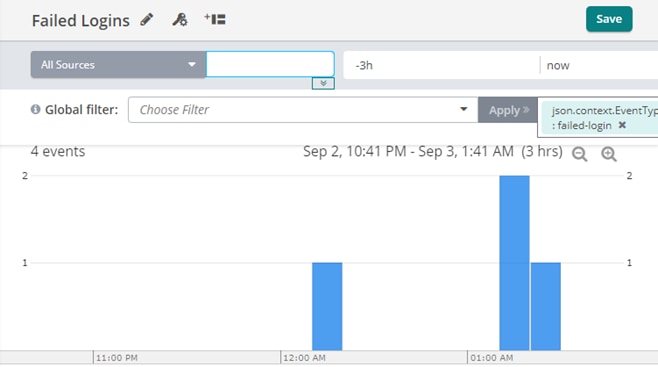
Having such charts handy would be invaluable for a site administrator.
Conclusion
Managing and actively monitoring a single busy WordPress site can be a full-time job, and handling multiple sites is even more overwhelming. Keeping up with complicated themes, plugins, and analytics—while also updating content and attending to overall server maintenance—is enough to take most of your time. You don’t need log management on top of that!
The WordPress Activity Log plugin with its Loggly integration can give you the support you need. Both are easy to set up and offer intuitive interfaces while being feature-rich. In addition, both the plugin and Loggly have excellent support available. This combination is perfect not only for site administrators but also for digital marketers who want to monitor critical trends and performance metrics for their websites.
To test out your WordPress site’s activity logs in SolarWinds Loggly, sign up for a 30-day free trial.
The Loggly and SolarWinds trademarks, service marks, and logos are the exclusive property of SolarWinds Worldwide, LLC or its affiliates. All other trademarks are the property of their respective owners.

Loggly Team