Great News for MongoDB Users: Native Log Parsers Now Available from Loggly
Get More Visibility Inside Your MongoDB Instance
How do you verify that chunks are evenly distributed throughout your sharded cluster? Closely monitor your Balancer process? Want to ensure that your Mongo client connects seamlessly to your MongoDB? Keep an eye on your websvr process?
From minute process behavior (for example tracking what the Balancer and websvr processes are doing right now) to overall health metrics of your whole database (for example monitoring the performance impact of the new code that you just pushed), log messages give you the knowledge you need to keep your applications in a healthy state.
In the past, you might not have paid much attention to your logs because they are just too many of them. It’s not unusual to generate thousands of log messages per second. Perhaps your logs looked too complex. Either way, ignoring your logs means that you’re missing out on a gold mine of data.
Loggly’s new MongoDB log parsers will provide ways to explore your MongoDB logs and extract value from them through advanced analytics. You can now automagically transform semi-structured proprietary individual events into meaningful and rich messages that provide actionable insights. And of course you continue having visibility in Mongo’s supporting host, the application(s) that hammer on them and/or the infrastructure that supports all of these.
Comparing a Raw Log to a Parsed Log
Consider the following MongoDB event received from our syslog forwarder concerning the Balancer process.
Fri Feb 14 18:35:52.346 [Balancer] distributed lock ‘balancer/ip-10-168-238-101:27017:1392359581:1804289383’ acquired, ts : 52fe62071b4dea42458a61ac
If you are log-lingual, you can probably interpret such a message. But even then, it’s not easy to put this message in context with the other thousands or millions of similar messages or convert it into meaningful statistics.
Our parser will neatly decompose such a message into all of its fields and will allow you to perform analysis on any and each of its fields separately.
The same MongoDB event after parsing:
- syslog:
- severity:
- informational
- appName:
- 21logglymongomongosconf
- timestamp:
- 2014-02-14T18:35:57.221690+00:00
- facility:
- local use 0
- priority:
- 134
- host:
- ip-10-168-238-101
- severity:
- mongo:
- timestamp:
- Fri Feb 14 18:35:52.346
- module:
- Balancer
- timestamp:
- Others:
- Message: distributed lock ‘balancer/ip-10-168-238-101:27017:1392359581:1804289383’ acquired, ts : 52fe62071b4dea42458a61ac
Here’s an example of a Mongo Websvr logs:
<45>1 2013-09-05T07:54:17.741328+00:00 logglymongo app web – Fri Mar 21 18:14:17.136 [websvr] admin web console waiting for connections on port 28017
The same MongoDB event after parsing:
- syslog:
- severity:
- Notice
- appName:
- app
- timestamp:
- 2013-09-05T07:54:17.741328+00:00
- facility:
- messages generated internally by syslogd
- priority:
- 45
- host:
- logglymongo
- severity:
- mongo:
- timestamp:
- Fri Feb 21 18:14:17.136
- module:
- websvr
- timestamp:
- Other:
- Message: admin web console waiting for connections on port 28017
This clean organization suddenly opens some unique opportunities to get deep packet visibility, and to see inside application payloads.
Answer Ad Hoc Questions and Understand What-if Scenarios
A parsed log helps you answer many types of questions that you (or your boss) may have because you can slice and dice your application’s behavior with very fine granularity. Loggly’s intuitive user interface lets you ask your questions using common search parameters, filter your results, and instantly view your data in a graphical form so you can easily identify patterns, peaks, and valleys that require attention.
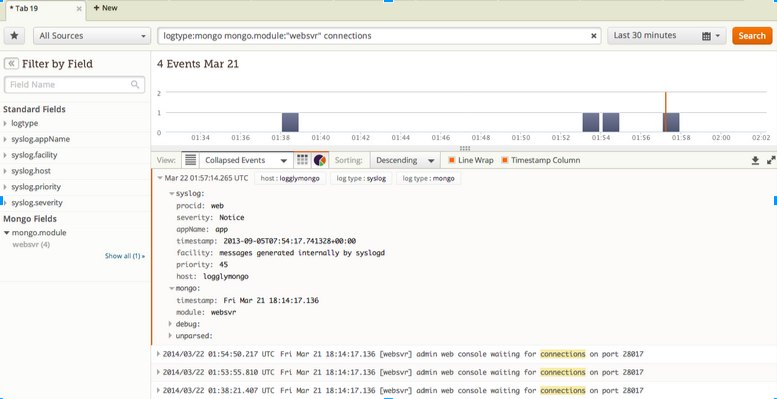
Let’s say that you are now troubleshooting a Mongo client that cannot connect to your DB. You suspect that the websvr process is the culprit, so you ask, “How many connections events has the websvr process generated in the past half hour?”
Here is Loggly’s answer to that question. Notice that the websvr process is alive, up and running, and accepting connections on port 28017. 28017?? Bingo, the port 28017 is the wrong one for my app. Quick identification, quick fix.
Suppose that you are troubleshooting intermittent misbehavior from your application. You may want to ask the following questions:
- “How many times did the application ‘21logglymongomongosconf’ access mongo’s Balancer between 2PM and 3PM on Friday February 14th?”
- “How many events did I get from application ‘21logglymongomongosconf’ between 2PM and 3PM on Friday February 14th?”
Imagine that you are doing some capacity planning exercise. You may want to ask:
- “How many different hosts (with unique IP address) are generating events related to mongo’s Balancer on Thursday February 13th?”
- “What are the monthly trends for how many times any application has accessed mongo’s Balancer this month of February?”
A parser will give you native access to all of these features. You don’t have to write complex ad-hoc regex queries for each new scenario.
Create Custom Dashboards for Important Views
Say that you have pushed a new code base and you want to insure that it plays nicely with Mongo. You usually want to start with a dashboard that captures the views that you are interested in, for example:
- “Show me the real-time histogram of the number of times my Mongo’s Balancer is accessed.”
- “Show me the real-time histogram of how many events are generated by host with address ‘ip-10-168-238-101’”
Once again, parsed logs allow you to quickly create dashboards that articulate exactly what you need to see and to easily update these views as your needs change.
Proactively Monitor for Exceptions
So now your new code base is more or less under control and you feel that you don’t need to monitor your solution 24×7. You don’t want to be in the dark, so you decide to set up some alarms that trigger if your Mongo DB’s behavior goes out of bounds.
For example, you may want to keep an eye on the sheer number of messages coming from Mongo’s Balancer process.
- Excessive load: “Alert me if I get more than 100 messages per second coming from Mongo’s module called ‘Balancer’ on host with address ‘ip-10-168-238-101’”
- Service unavailability: “Alert me if I get NO message for more than 10 seconds coming from ‘21logglymongomongosconf’”
With Loggly, you can rest assured that you’ll get a text message or an email (Loggly interfaces nicely with PagerDuty) if you need to get involved.
How to Set it Up
You can enable your MongoDB instance to write log files by following the steps in https://docs.mongodb.org/manual/administration/monitoring/#process-logging
More information on rotating log files can be found in https://docs.mongodb.org/manual/tutorial/rotate-log-files/
Once these files are being generated and rotated, you have the choice between uploading these to Loggly or monitoring these for real-time updates.
But don’t take our word for it! Sign up for our free trial, and you’ll see what Loggly can do for yourself, for your MongoDB logs, and any other logs that you may have: Actionable insights with no agents, no downloads, and no sweat.
The Loggly and SolarWinds trademarks, service marks, and logos are the exclusive property of SolarWinds Worldwide, LLC or its affiliates. All other trademarks are the property of their respective owners.

Hector Angulo