How to use dashboards and alerts for data monitoring
Data monitoring is a crucial component of any deployment. Being able to track and respond to changes in your infrastructure can help reduce downtime, increase performance, and improve the overall efficiency of your platform. In this post, we’ll explore two data aggregation methods that can vastly improve your logging experience: dashboards and alerting. We’ll explain what they are, how they’re best used, and why so many people often get them confused.
What Is a Dashboard?
Dashboards offer a summarized view of the different components of a system. They gather key metrics from various components and present them in a way that you can check at a glance. Dashboards can display anything from resource consumption to average response times. Dashboards also contain historical data about each metric, helping you recognize trends and patterns without having to dig through piles of data.
What Is an Alert?
Alerts notify you of potential problems or conditions detected within your system. When a certain pre-defined threshold is met, an alert will generate a message and send it to a specified recipient. The content of an alert is also very limited, describing only the parts of the system that were affected by the failure.
How Are Dashboards and Alerts Different?
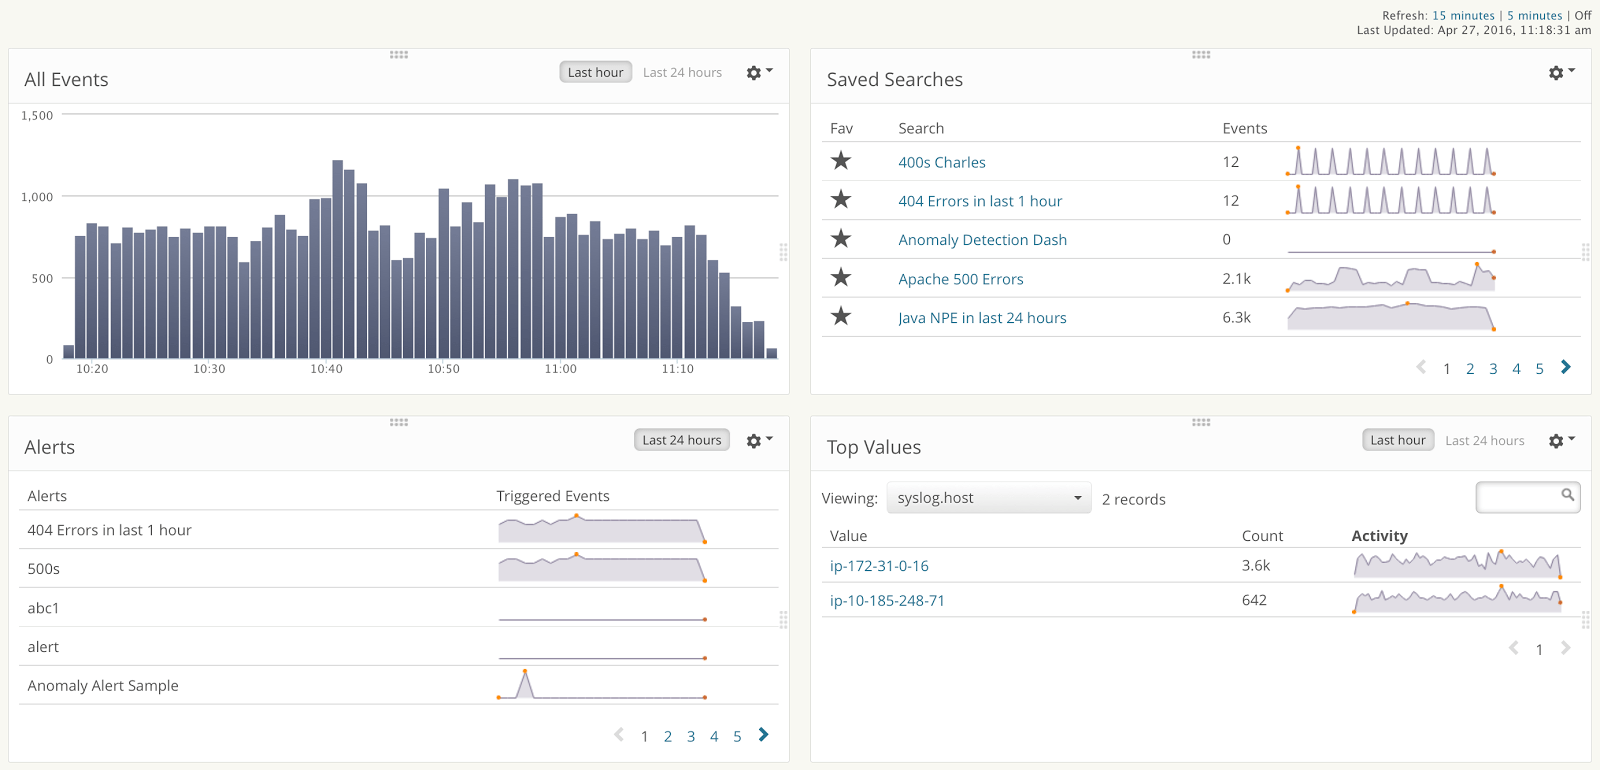
Although they both convey key information about the state of a system, dashboards and alerts have two very different functions. Dashboards allow users to quickly view the state of a system up to the present moment. Dashboards provide a high-level overview of various system components, making it easy to identify trends and patterns. Dashboards are often visual and display information in the forms of charts and graphs. With services such as Loggly, dashboards can also be easily shared with multiple users.
Alerts, on the other hand, are much more behind-the-scenes. Most of the time, alerts are only apparent when a specific condition arises or a certain threshold is passed. Alerts contain a very limited amount of data, typically pertaining to the area(s) of the system affected by the alert at the time the alert occurred. And whereas users have to open a dashboard, alerts are sent directly to their destination via email, an HTTP request, or a third-party notification service like HipChat, Slack, PagerDuty, or VictorOps.
Why You Shouldn’t Use Dashboards for Alerts or Vice Versa
Dashboards can convey large amounts of information quickly, but finding relevant information in the event of unusual behavior can quickly become difficult. If you try to use a dashboard to respond to errors or issues, you’ll quickly run into several problems:
- You won’t be automatically notified of unusual behavior.
- You’ll have to continuously monitor the dashboard to detect errors and potential errors.
- You may be more likely to flag false positives as valid incidents, since dashboards often summarize or aggregate details in favor of simplicity.
Alerts allow you to quickly respond to potential problems with your infrastructure. However, it can be very tempting to overuse alerts as a way of staying on top of your infrastructure. This presents its own set of problems:
- Users have to wait to be notified of changes to the system.
- Only specific users will receive an alert when it sends.
- Alerts have a much more narrow scope than dashboards, making them less effective at conveying a broad view.
- When an excessive number of alerts starts pouring out of your infrastructure, recipients will quickly become fatigued, resulting in a higher number of ignored incidents.
When implemented correctly, dashboards and alerts work together very effectively. Dashboards provide a broad, high-level overview of your system at any given moment. Meanwhile, alerts continuously (and hopefully quietly) monitor your system for potential problems. Dashboards complement alerts by letting users browse the status of the system on their own terms, and alerts complement dashboards by providing important information when it’s needed.
Getting Started with Dashboards and Alerts
Before creating a dashboard or an alert, consider the metrics that are key to your infrastructure. Review your infrastructure from both an architectural and usability perspective. If the metric is a critical component of your application, such as database availability, you may want to create an alert. If the metric is geared more towards the ongoing state of your infrastructure, such as the number of users currently logged in to your application, consider creating a dashboard.
This video covers the basics of Loggly dashboards.
Imagine we have an application that relies heavily on a backend database. We log our entire stack to Loggly, which parses and aggregates the log data. In the following examples, we’ll use our log data to create some sample alerts and dashboards.
Sample Alerts
If the database goes down, we want to be notified as soon as possible. We’ll create an alert that looks for a large number of stack traces or exceptions in a short amount of time (e.g. five minutes). This could indicate anything from an offline server to a corrupt database. We’ll send this alert to our database admin.
Next, we’ll create an alert that detects a sudden drop-off in log volume. For example, if our application typically logs 100 events a minute, a drop to 10 events per minute could indicate unresponsive software or a network failure. There’s a chance that the log volume can dip below the threshold before quickly reverting to its normal volume, so you may want to integrate anomaly detection into your alert to prevent too many false positives.
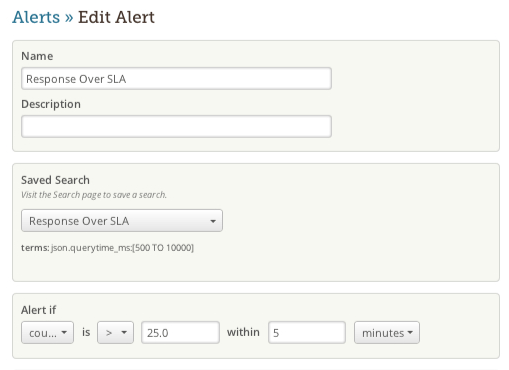
Finally, we’ll create an alert that detects slow query times. Each of our database logs includes a field containing the time it took to run a query. To ensure our users aren’t running into latency issues, we want to be notified if a query takes longer than a few seconds to run. We’ll create an alert that searches for the highest query time over a period of time (e.g. five minutes) and alert the engineering team if it exceeds an acceptable threshold.
Dashboards to Set Up
With dashboards, we want to measure certain qualities of our application without necessarily looking for errors. To start, we’ll create a dashboard that extracts and displays the most frequently occurring database errors. This lets us know what areas of our application we need to address to improve performance and reliability.

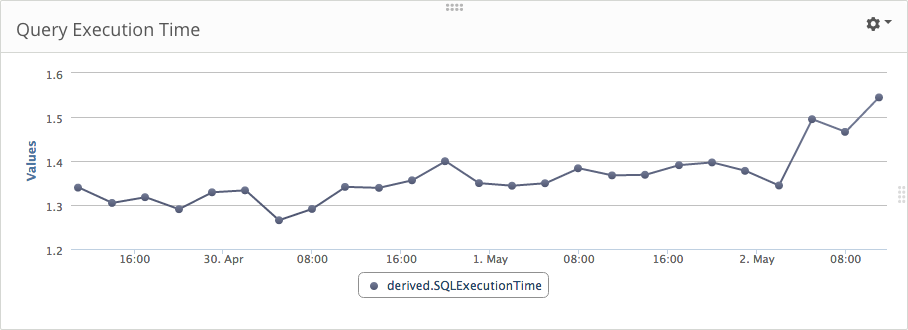
Next, we’ll create a dashboard that shows the average execution time of database queries. In the example below, you can see the average time spikes after May 2. You might even want to create an alert that notifies you when the average jumps above a certain threshold.
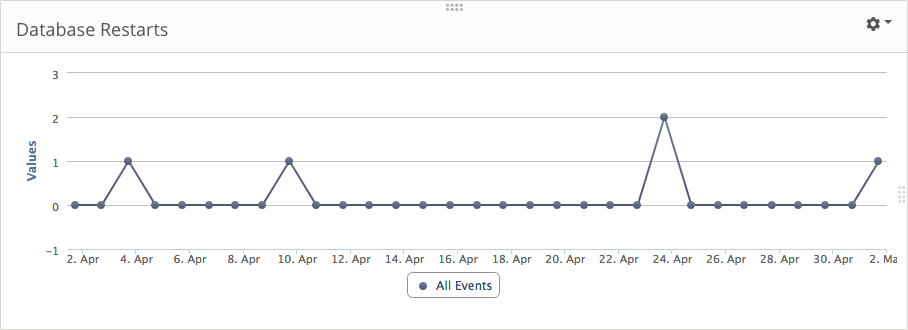
Our last example shows how dashboards can work alongside reports to provide historical information. The dashboard measures the number of times the database service was restarted. We can see that the database was only down a few times during the month of April. Fortunately, we configured an alert to notify the DBA when downtime was detected, so each incident was short-lived.
If you have a dashboard or alert that you wish to share, please mention it in the comments section below.
The Loggly and SolarWinds trademarks, service marks, and logos are the exclusive property of SolarWinds Worldwide, LLC or its affiliates. All other trademarks are the property of their respective owners.

Andre Newman