Pinpointing a Memory Leak For an Application Running on DigitalOcean
It can be difficult to track down memory leaks, especially when deploying apps on cloud-based application services. Often teams are left with restarting their apps as the only—and less than ideal—recourse to get them back up and running.
So what do you do when your cloud-based app springs a memory leak, and how do you pinpoint the cause? In this article, we’ll create a Java app designed to purposely leak memory and deploy it to DigitalOcean. Then, we’ll use SolarWinds® Loggly® and AppOptics™ to give us the information we need to analyze and diagnose this situation.
Memory Leaks
Memory leaks occur when a program fails to correctly manage the utilized memory allocations. While compilers and IDEs have made impressive strides to assist the developer in avoiding patterns that introduce a memory leak, memory leaks still exist and are often difficult to troubleshoot, especially when they cannot be easily reproduced in a development environment.
From a Java perspective, developers rely on the garbage collection process to free up memory on the Java heap. In cases where objects remain in a state not permitting garbage collection, the memory allocation remains in use but is no longer available. The more times this ill-favored pattern repeats, the more memory will leak, resulting in an out-of-memory error for the application.
It’s common to miss memory leaks in Java because the java.lang.OutOfMemoryError doesn’t inherit from the java.lang.Exception class, and cannot be detected in a typical try/catch block. In fact, in the majority of cases where I’ve encountered an out-of-memory situation, the client has resorted to restarting systems to cure the issue. In one extreme case, a client used a scheduler to automatically restart their applications several times a day.
So let’s create a simple RESTful service using Spring Boot and deploy it onto DigitalOcean. The service contains a single GET endpoint designed to consume the service memory (if the proper parameters are passed into the request). We’ll then integrate the SolarWinds product suite into our deployment, which will help pinpoint the memory leak.
Creating a RESTful Service
Using the Spring Boot framework, a RESTful service can accept GET requests. For this article, we will use the following bad-code-service repository on GitLab:
https://gitlab.com/johnjvester/bad-code-service
When this service starts, the following URI becomes available:
GET <hostname>/runOutOfMemory?iterations=<iterationsValue>&logInterval=<logIntervalValue>

where:
iterations is the number of list additions which will be performed (default value is 100,000,000)
logInterval is the interval in which updates are logged (default value is 1,000,000)

returns:
200 - OK when the process runs successfully (does not run out of memory creating the list)
400 - BAD REQUEST when an unexpected error occurs
500 - INTERNAL SERVER ERROR when the request runs out of memory
The core of this repository continues to place values into a ‘java.util.ArrayList‘ until the system runs out of memory.
runs out of memory.
@Service
public class OutOfMemoryService {
final static Logger logger = LoggerFactory.getLogger(OutOfMemoryService.class);

public int populateList(int iterations, int logInterval) throws OutOfMemoryError {
logger.info(“populateList(iterations={}, logInterval={}),” iterations, logInterval);

final List<Double> list = new ArrayList<>();

for (int i = 0; i < iterations; i++) {
list.add(Math.random());

if (i > 0 && i % logInterval == 0) {
logger.info(“Processed {} items,” String.format(“%,d,” i));
}
}

return list.size();
}
}
Since this is a Spring Boot application, it can run using the following command:
java -jar bad-code-service-0.0.1-SNAPSHOT.jarDeploying to DigitalOcean
DigitalOcean provides cloud services to help deploy and scale applications. As of 2020, DigitalOcean is the third largest company in the hosting space. DigitalOcean is designed to make cloud adoption effortless, especially when compared to alternate options.
DigitalOcean provides scalable virtual machines, known as Droplets. Users can initialize and create Droplets in a matter of seconds. For this example, we’ll create the following Droplet:
- Ubuntu 20.04 (LTS) x64
- Basic (Shared CPU)
- 1 GB/1 CPU
- 25 GB SSD disk
- 1,000 GB transfer
Since Spring Boot requires Java, you’ll need to enter the following in the DigitalOcean console:
apt-get update
apt install openjdk-8-jre-headless
After installing Java, we created a folder called var/bad-code and copied the bad-code-service-0.0.1-SNAPSHOT.jar using the following command:
scp -r bad-code-service-0.0.1-SNAPSHOT.jar root@1.2.3.4:/var/bad-codewhere: 1.2.3.4 is the IP Address displayed on the Droplet console.
At this point, we can start the Spring Boot service using the following command:
java -jar bad-code-service-0.0.1-SNAPSHOT.jarWe can then execute the following cURL command functionality:
curl—location—request GET ‘http://1.2.3.4:8080/runOutOfMemory?iterations=1000&logInterval=100’Using 1,000 iterations shouldn’t cause the Spring Boot service to run out of memory, and it should return a 200 (OK) HTTP status code. Before attempting to introduce the memory leak, we should add a Loggly and AppOptics integration.
Integrating with SolarWinds
SolarWinds provides cloud-based options to manage applications, databases, and the infrastructure they run on. To track down our memory leak, we’ll use Loggly (log management) and AppOptics (application performance monitoring).
Setting Up Loggly
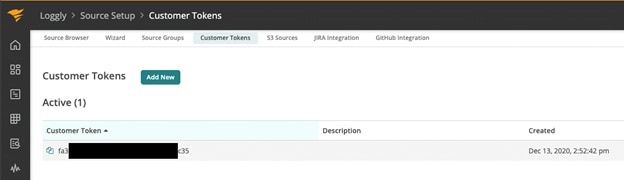
After creating an account, navigate to the Loggly | Source Setup | Customer Tokens screen within the SolarWinds Customer Portal. The following screen should appear:
Include the value of the Customer Token in the LOGBACK_URL system property, which you can set in the Droplet Console:
export LOGBACK_URL=https://logs-01.loggly.com/inputs/<customer_token_goes_here>/tag/logbackBecause the necessary dependencies and configuration already exist in the bad-code-service repository, the Spring Boot service will automatically direct the log events from the Droplet into Loggly.
Adding AppOptics
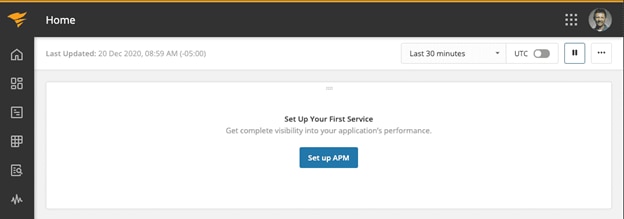
From the Home screen of the SolarWinds Customer Portal, AppOptics can be set up by using the Set up APM button:
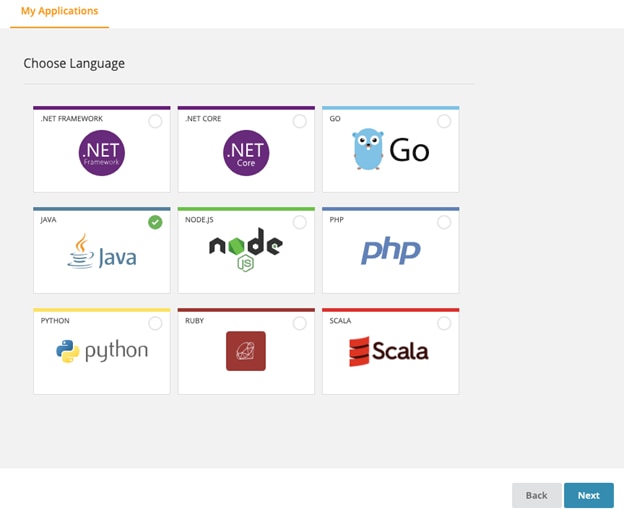
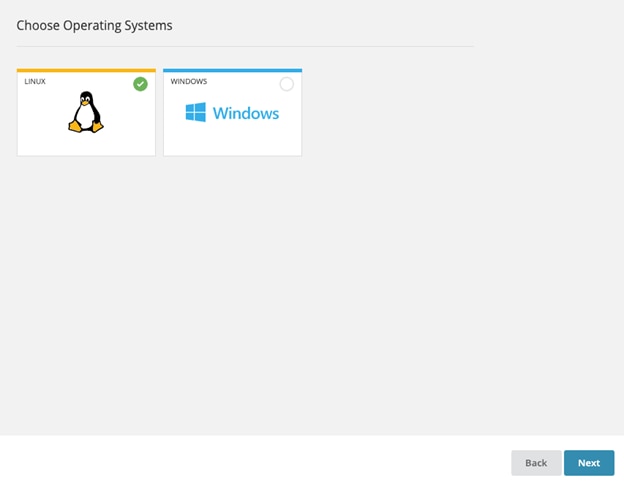
We selected Java from the list of options shown below:
We also selected LINUX, since it’s what we’re using in the Droplet:
Next, we see the following screen:
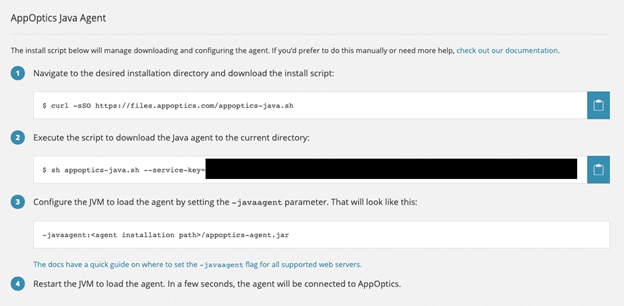
We should execute the scripts noted above in the Droplet console and in the var/bad-code folder to keep things simple. Please note, if the Spring Boot service is still running, you’ll need Control-C to stop the service.
After the AppOptics commands have finished, update the java command to start the service:
java -javaagent:./appoptics-agent.jar -jar bad-code-service-0.0.1-SNAPSHOT.jarAt this point, both Loggly and AppOptics should be capturing information from the Spring Boot service running in DigitalOcean.
Creating the Out-of-Memory Error
The virtual machine running the DigitalOcean droplet has 1 GB RAM. While it’s possible for the Spring Boot service to run out of memory, it’ll take a long time. As a result, we can start the Spring Boot service with a maximum memory allocation via the -Xmx property. For this example, we will allocate 64 MB to the Java execution:
java -Xmx64m -javaagent:./appoptics-agent.jar -jar bad-code-service-0.0.1-SNAPSHOT.jarOnce the Spring Boot service has started, we can send the following cURL command to the Droplet:
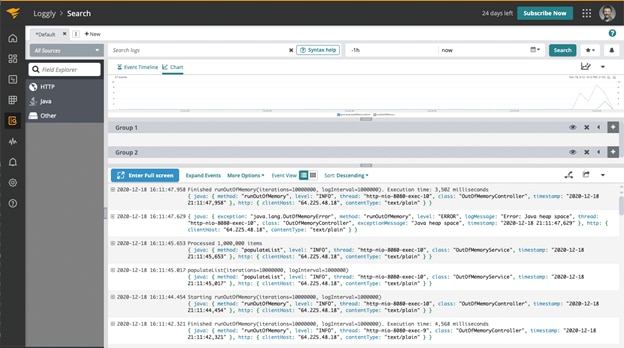
curl—location—request GET ‘http://1.2.3.4:8080/runOutOfMemory?iterations=100000000&logInterval=1000000’With only 64 MB of RAM available, the request to process 100,000,000 iterations should fail in a matter of seconds. When this happens, we’ll immediately see the issue in Loggly via the Logs | Log Explorer option within the SolarWinds Customer Portal.
Loggly has quickly identified the out-of-memory error without looking into the DigitalOcean environment. This allows the DigitalOcean environment to remain secure while providing feature developers with the necessary logging required to support their applications. In the screenshot below, we can easily view both the INFO and ERROR messages, and analyze and export them.
In most cases, the catch (Exception e) logic fails to reveal the OutOfMemoryError. However, the OutOfMemoryController in the bad-code-service repository uses the following approach:
try {
logger.info(“Successfully created a map with {} value(s).,” String.format(“%,d,” outOfMemoryService.populateList(iterations, logInterval)));
} catch (OutOfMemoryError | InternalError e) {
logger.error(“Error: {},” e.getMessage(), e);
httpStatus = HttpStatus.INTERNAL_SERVER_ERROR;
} catch (Exception e) {
logger.error(“Error: {},” e.getMessage(), e);
httpStatus = HttpStatus.BAD_REQUEST;
} finally {
LocalDateTime finished = LocalDateTime.now();
logger.info(“Finished runOutOfMemory(iterations={}, logInterval={}). Execution time: {} milliseconds,” iterations, logInterval, String.format(“%,d,” start.until(finished, ChronoUnit.MILLIS)));
}
The cURL command should then receive the 500 Internal Server Error response.
Diagnosing the Situation
Now that we can easily reproduce the Out-of-Memory error, we stopped and restarted the Spring Boot service without the 64 MB restriction:
java -javaagent:./appoptics-agent.jar -jar bad-code-service-0.0.1-SNAPSHOT.jarWe then executed the same cURL command several more times, which took more time to yield the Out-of-Memory error due to the 1 GB of RAM available to the Droplet in DigitalOcean:
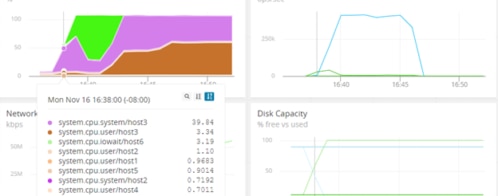
curl—location—request GET ‘http://1.2.3.4:8080/runOutOfMemory?iterations=100000000&logInterval=1000000’While the program is consuming memory, we look at the AppOptics dashboard, which shows the following results:
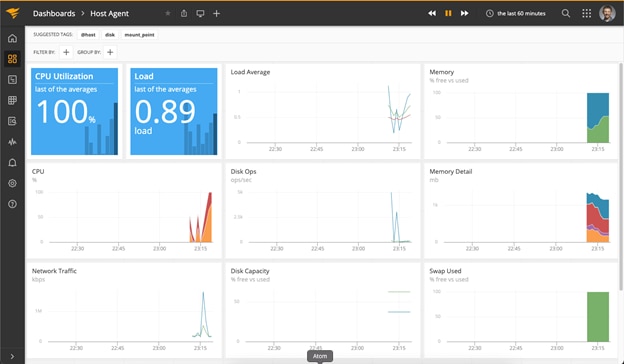
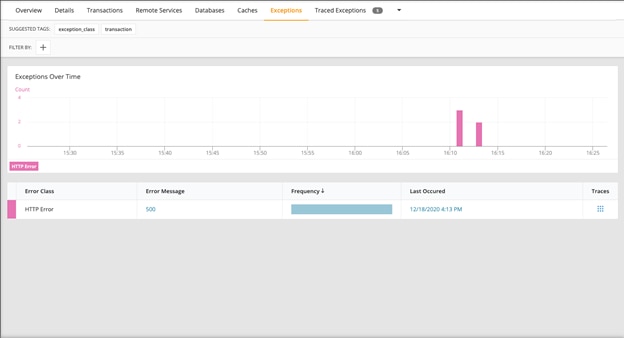
We can see the excessive use of memory on the right side of the dashboard. By navigating to the Services section of the AppOptics dashboard and the Exceptions tab, we see the registered 500 error:
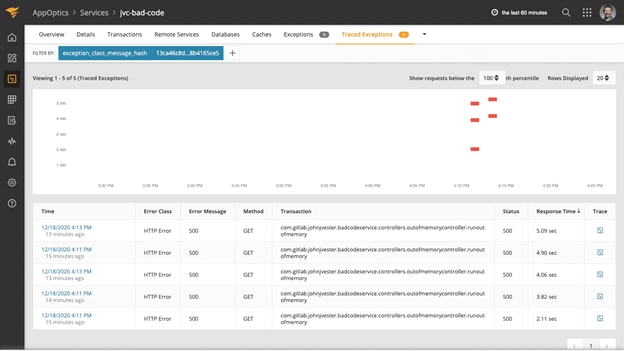
From there, we can then view the Traced Exceptions, mirroring the number of times the same (failed) request was attempted:
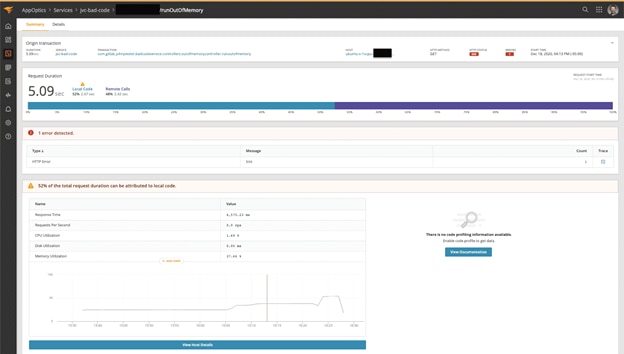
Select a Trace to see a summary:
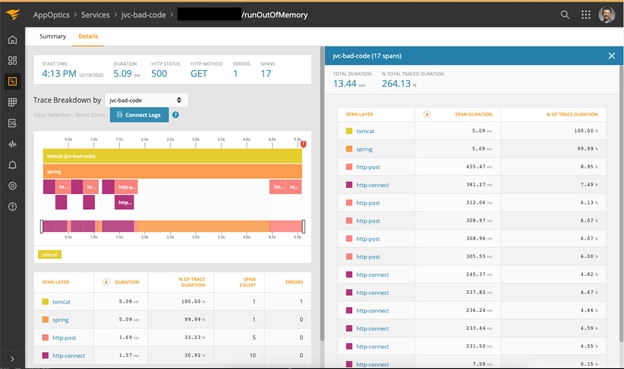
Interestingly, the Details tab provides a full trace breakdown for the request:
With AppOptics, we can see an overall view of the state of the application. These infrastructure metrics are key to help us understand and pinpoint issues, such as an out-of-memory situation. We can then take it a step further and set thresholds within AppOptics. We can also configure warnings to notify support teams before an actual outage occurs.
There’s also an option to link AppOptics and Loggly events using a unique trace ID between both systems. This allows us to tie AppOptics results data directly to associated log events.
Conclusion
Feature developers often employ try/catch blocks to catch exceptions based upon the java.lang.Exception class. Unfortunately, out-of-memory exceptions don’t fall into those blocks, nor do messages from the java.lang.InternalError class. This often creates confusion as to what’s happening when applications are running in a cloud-based environment.
In this example, Loggly was connected to the Spring Boot application, which provides support teams with the ability to view detailed log information from services running in the cloud. While this provides impressive log data, the real power comes into play when connecting AppOptics to the Spring Boot service. This combination makes it easier for teams to quickly analyze scenarios in a development environment, saving them precious time in getting your apps back up and running, and your customers back in business.
The Loggly and SolarWinds trademarks, service marks, and logos are the exclusive property of SolarWinds Worldwide, LLC or its affiliates. All other trademarks are the property of their respective owners.

Loggly Team