Searches in Loggly Simplified
SolarWinds® Loggly® was built to cut through large volumes of noisy log data to quickly pinpoint the exact events relevant to your search. Whether your log data is structured into neat field and value pairs which lend themselves to precise search queries or written in unstructured text blobs, Loggly enables you to extract meaningful insights from your logs—even if you’re not a query master. Let’s look at a few ways you can begin to harness the power of Loggly search and start getting more value from your log data.

At First Glance
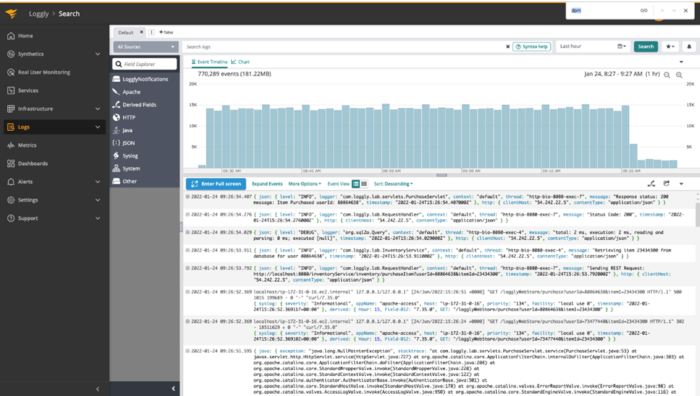
The way the Loggly team built the search interface, you can begin your log search as soon as you open the search window. You can view the event volume over time, quickly pull up your saved searches, and see a summary of the field categories in the past 10 minutes. The real power, however, is in the Loggly Dynamic Field Explorer™.
Dynamic Field Explorer
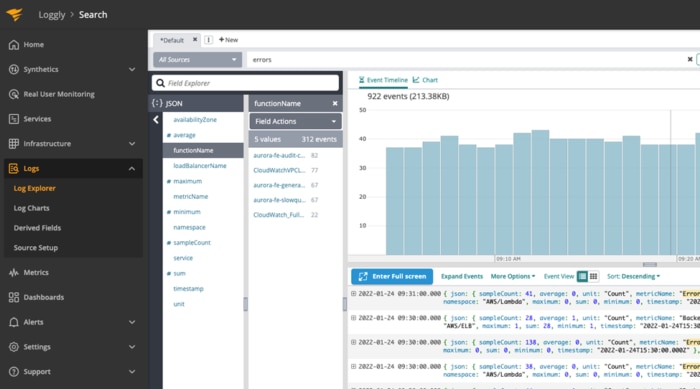
One of the big advantages of using Loggly search is that you aren’t starting from an empty page. When you open a search tab, the Dynamic Field Explorer opens on the left side of the screen and displays the field categories from events in the last 10 minutes. The Dynamic Field Explorer window displays field categories, field names, and values, presenting a structured summary of your log data. It’s like a map of your events, highlighting both the most common events and the anomalies.
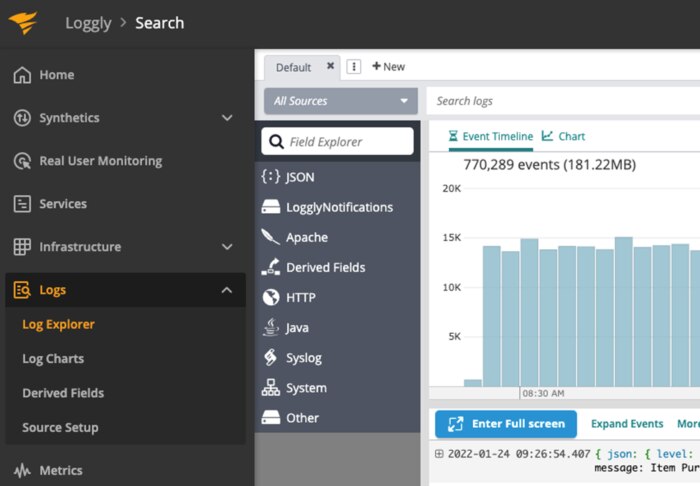
For example, if you select a field category, you’ll see a list of all the known fields associated with that category. When you select one of the fields from the list, you’ll see the number of values and events for that field. In this interactive interface, the Dynamic Field Explorer allows you to zoom in on specific events with just a few clicks.
Even as you interact with various fields and values, the Dynamic Field Explorer updates the data view to provide metrics and data relevant to your search. The combination of the analytics with an interactive data view accelerates log searches and eliminates time consuming trial and error searches.
Let’s Take a Field Trip
The Dynamic Field Explorer is a great place to start your searches, especially if you’re not sure what you’re looking for. It eliminates the need to learn a new search language or be familiar with field names or syntax. You can immediately begin searching events and identifying patterns.
The Dynamic Field Explorer is the perfect tool for getting to the root cause of a problem when you don’t know where to start. If there’s an outage, for example, you can use the Dynamic Field Explorer to navigate to the specific time window when the outage occurred. You can then use the search function to identify matching results in the specific time window, if you have a hunch as to what might be going on.
If you’re not sure what’s happening or your search didn’t produce an obvious answer, you can use a field action to plot a trend graph or a timeline chart and start visually exploring the data. As you begin to see patterns and outliers begin to emerge, you can use the field value search function or quick filtering capabilities to focus your search and identify the chain of events that led to the issue.
With the Dynamic Field Explorer, you can execute targeted searches over large volumes of data without writing elaborate search queries. It’s all point and click. You don’t need to be familiar with the underlying architecture of application, service, or infrastructure. This makes the Dynamic Field Explorer a perfect search tool if you’re not a whiz at constructing elegant queries.
Queries in Loggly
The Dynamic Field Explorer is powerful tool for many situations, but there are certain issues that only a well-constructed search query can tease apart. The query search language in Loggly lends itself nicely to these types of challenges. It’s based on Apache Lucene, which is the foundation of Elasticsearch. It’s a high-performance full-text search designed to quickly and precisely search large amounts of data.
First Steps
A great way to start building a query or generally start searching in Loggly is to leave the search box empty and select “Search.” This will pull up all the data in the last hour and give you a good idea of what the current state of your environment is. Searching using an empty search box is also a great way to start over if you start down one search path and it doesn’t pan out. You can focus your search before you start typing queries by selecting a source group on the left or adjusting the time range on the right.
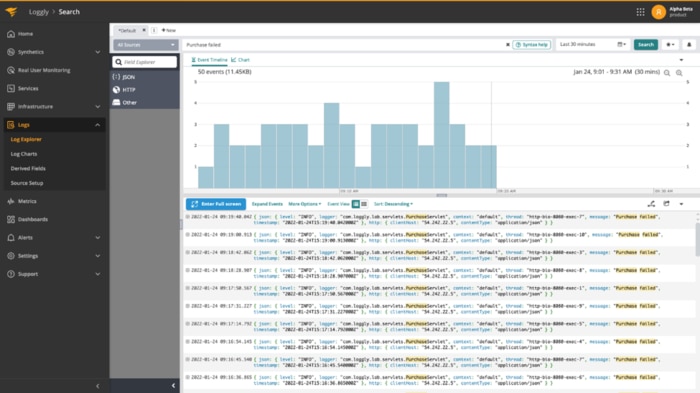
From there you can type simple strings into the search box like error or retries or phrases such as purchase failed to pull up matching events. Loggly uses a full text search across both structured and unstructured log types, which means every string within your data is searchable. Once you get the hang of using strings to search, you can take it one step further and join multiple strings or phrases together using Boolean operators such as AND, OR, NOT, but more on that later.
Filter to Focus
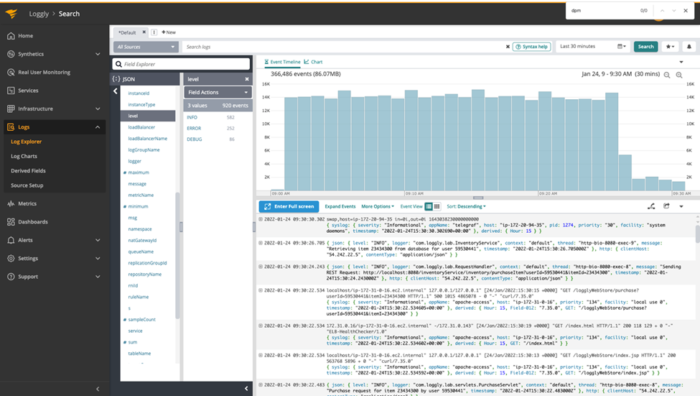
When you’ve executed a search and a large number of results are returned, you can use filtering to drill into results. Filtering in Loggly leverages the interactive capabilities of the Dynamic Field Explorer along with power of the query language. This combination allows you to start with a broad text search and by applying or removing filters start to iteratively refine your search.
For example, you can type a general search, such as errors, in the search bar and receive more the 55,000 matches.
To remove a filter, select the X next to the filter in the Applied Filters bar. You can also remove all filters by using the toggle next to Applied Filters.
You can continue to apply and remove filters to search within the set of initial query results. If your initial intuition was right, then by iteratively applying and removing filters, you’ll find the event messages that tell you what broke and potentially why, even among terabytes of event messages. Filters allow you to start your search broadly and progressively narrow down the matches to quickly pinpoint an issue. And filters don’t require complicated multiline regex queries.
Diving in Deeper
As mentioned earlier, the query language accepts Boolean operators AND OR NOT TO and supports using the plus (+) and minus (-) symbol. To use the + or - operator, place it in front of the query term and don’t separate it with a space. A space in front of a query term is interpreted as an AND operator by Loggly. This means typing the any of the following in the Loggly search bar would pull up the same set of results:
purchase AND failed
purchase+failed
purchase failed
There’s so much you can do with Loggly queries. You can group query terms using parentheses to have Loggly process the terms in parentheses first. Using field names and field values, you can perform a range search, say for example nginx.status:[400 TO 499]. The Loggly query language also supports wildcards. Specifically, the wildcard asterix (*) matches more than one character and the question mark symbol (?) matches just one character.
You can use regular expressions (regex) to create detailed queries and match patterns in your logs. To use regular expression searches, put the regex between forward slashes (/). Regex support is in beta mode, and there are a few limitations. See the latest documentation before you start building out detailed regex queries.
Wrapping Up and Resources
Loggly offers several ways to search. Whether you’re a query newbie or long-time veteran of Lucene queries, you can leverage the power of Loggly to find exactly what you’re looking for. There’s extensive information on everything you can do using the Loggly search in the Loggly documentation.
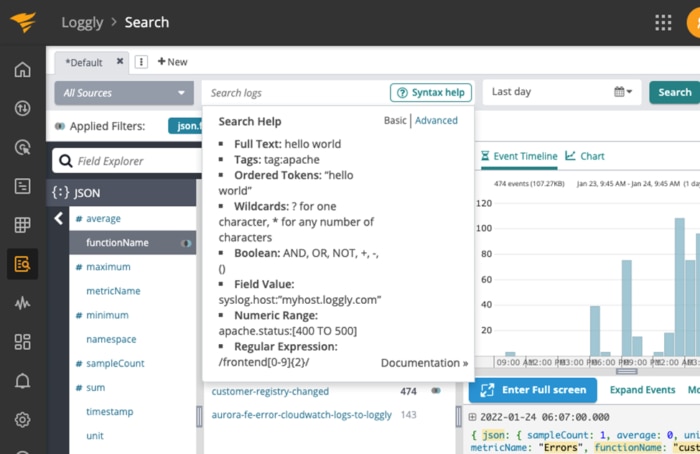
There’s also syntax help right in the Search interface. When you select Syntax Help, which is to the right of the search bar, you’ll see helpful examples you can use to build queries. It’s like an in-app cheat sheet.
For a more complete search reference that covers not only query syntax, but also the Dynamic Field Explorer and filters, check out the newly revised Loggly Search Cheat Sheet.
Of course, the expert Loggly support team is always there to help work through any questions on search, queries, or anything Loggly. If you build a query you’re proud of or use search to isolate an elusive issue, please tweet us @Loggly to share.
The Loggly and SolarWinds trademarks, service marks, and logos are the exclusive property of SolarWinds Worldwide, LLC or its affiliates. All other trademarks are the property of their respective owners.

Loggly Team