Survey Says… Analyzing Logs with Loggly Dynamic Field Explorer Saves Significant Time
Last month, we surveyed Loggly customers to get their stories of how they are using Loggly Dynamic Field Explorer™ and the benefits they are realizing. In my last post, I dove into some use cases on why Dynamic Field Explorer™ helps to change the way that people troubleshoot operational issues by eliminating some of the hard work that has traditionally eaten up many hours for developers and DevOps. In this post, I’ll share some findings directly from customer’s feedback on how Field Explorer helps them find what they need faster.
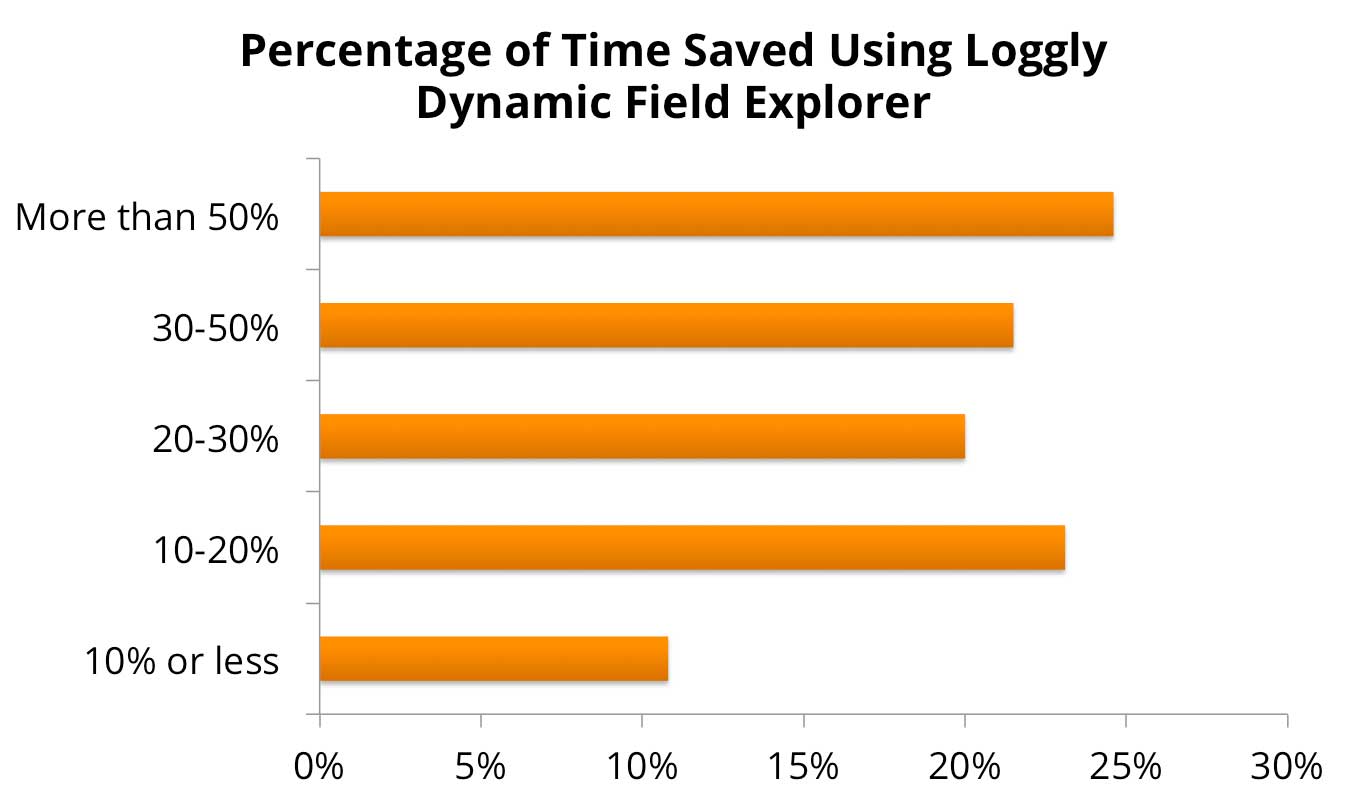
Finding #1: Log Analysis Goes Much Faster with Loggly Dynamic Field Explorer
Two-thirds of Loggly customers report that Loggly Dynamic Field Explorer™ saves them at least 20% of their time in operational troubleshooting, while almost 25% report time savings of more than 50%.
When asked about the value of specific analysis capabilities in Loggly Dynamic Field Explorer™, our customers saw these as the most useful:
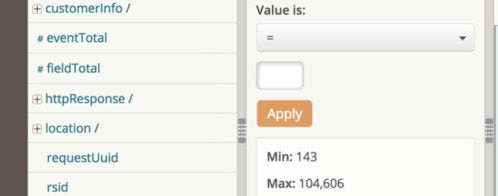
- Automatically exposing the fields in your logs before search: “Typically I hand-craft my queries, but I might use Dynamic Field Explorer if I can’t remember the valid values for a field — a host name or event category, for example.”
- Instantly displaying which event types are most and least common: “This allows us to immediately determine and focus responses to the correct areas of our systems.”
- Making it easy to filter out noise with metrics and one-click action: ” I was able to find that our Ads on different websites were throwing 404s/500 apache status errors just because of this. In case of any anomaly in our app , we are able to figure out in almost no time if the issue is due to code or if only one application box is not performing well. All we need to do is filter the logs by hosts.”
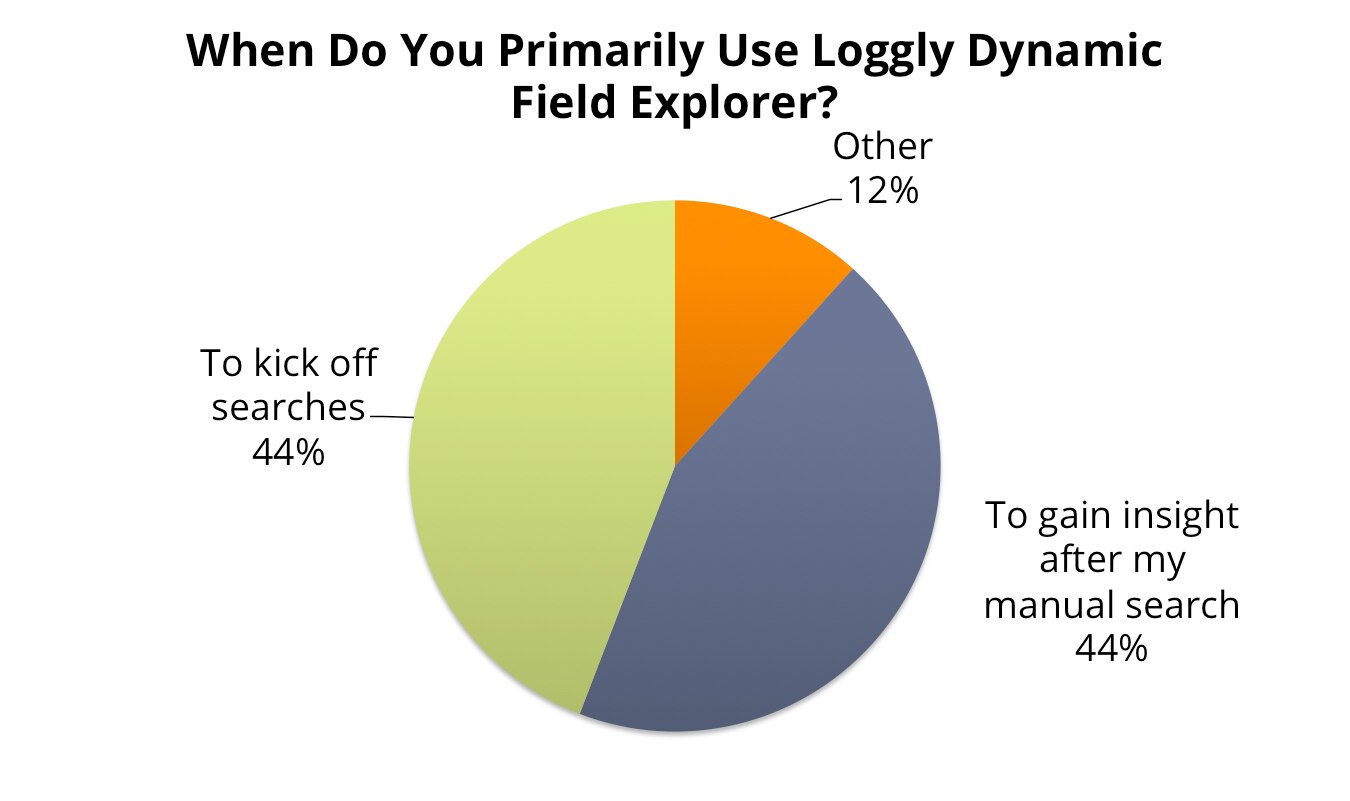
Finding #2: Customers Use Log Summaries Before and After Search
Developers are accustomed to life in the command line, so it’s not surprising that many of them look to Dynamic Field Explorer™ after they conduct a search. We saw an even split between customers who use Dynamic Field Explorer™ before and after search:
Here are a few of the insights they shared about how their troubleshooting processes have changed:
“After receiving alerts from Loggly, we’ve been able to identify not only which parts of our infrastructure are experiencing a problem, but whether there are specific hosts generating error logs”
“Being able to see immediately see exactly what queries we run on our MySQL DB has allowed us to quickly establish what procedures our breaking in our python DB code and efficiently debug our data retrieval processes.”
“Our system has multiple REST services. I frequently use Loggly Dynamic Field Explorer to isolate the service I am investigating. Once I have filtered to the service, I then use the Loggly Dynamic Field Explore to select the message codes, system devices, and other fields to very quickly narrow my investigation.”
Finding #3: Loggly Dynamic Field Explorer Will Open Up New Use Cases
Our customer survey revealed that customers are using Dynamic Field Explorer™ for things other than troubleshooting. For example:
“Using Dynamic Field Explorer allowed me to understand all the available data I had available to me in just a couple of minutes. From there, I had completed my first KPI analysis in under 10 minutes.”
“Being a both Dev and Ops guy, Loggly DFE is also reducing my work in Dev vertical…. I can get graphs of every field in Dynamic Field Explorer in no time which really helps in visualizing the data better.”
I have been following up with some of these customers to understand these new use cases better, not only so we can improve our product but also so we can educate other customers about how to get more from log management. Stay tuned for some upcoming posts sharing my findings.
And in the meantime, I’ll leave you with one of my favorite pieces of feedback from the survey:
“Thank you, Loggly! Gotta get a tattoo of the log!”
I’d love to see a picture!
You don’t have to get your own tattoo to celebrate the benefits of responsive log management. If you haven’t tried Loggly, sign up for a free trial and see how Dynamic Field Explorer can help your DevOps function. And if you are a customer with your own Dynamic Field Explorer stories to share, give us a twestimonial! Of course, my virtual door is always open; email me feedback at pm@loggly.com or DM @loggly on Twitter.
The Loggly and SolarWinds trademarks, service marks, and logos are the exclusive property of SolarWinds Worldwide, LLC or its affiliates. All other trademarks are the property of their respective owners.

Hector Angulo