Troubleshooting Firewall Issues in DigitalOcean
Introduction
DigitalOcean is a cost-effective virtual private server (VPS) provider popular among the developer community. The platform also offers services for rapid development, deployment, testing, and maintaining modern distributed applications. One of these services is a managed firewall solution that allows blocking unwanted traffic. It’s relatively easy to manage and deploy as an infrastructure component.
Sometimes, however, operations teams need to dig deeper when the firewall blocks network traffic. For example, a legitimate traffic port may be blocked due to human error during deployment or maintenance, disrupting service.
This article will detail how SolarWinds® Loggly® and SolarWinds Papertrail™ can be an effective monitoring solution for DigitalOcean firewalls and help identify network traffic-related issues.
Let’s start with a little background.
DigitalOcean
With DigitalOcean, teams and organizations can spin-up virtual servers—known as Droplets—typically within a minute. The platform also offers virtual private clouds (VPC), load balancers, firewalls, attached volumes, object storage spaces, Kubernetes clusters, managed database service, one-click application installs, or DNS service.
SolarWinds Papertrail
SolarWinds Papertrail is a simple but powerful log management solution designed by engineers, for engineers. It supports many log types and provides a real-time log tailing facility. This is coupled with a search and filter capability for users to extract specific events from large, busy log files without writing complicated commands.
When troubleshooting an issue, most system administrators are accustomed to logging into servers, finding application log files, and using a combination of “cat,” “tail,” and “grep” commands to search through the logs. For continuously changing logs, it can be a difficult task. It’s often necessary to search multiple sources for correlated events, making the process time-consuming.
Papertrail takes away much of this manual process. As a software-as-a-service (SaaS) solution, it’s easy to set up. After configuring source systems in Papertrail, log messages begin flowing into the system. Users can view these messages in real time from an easy-to-use, command-line interface style console. It’s also easy to search for messages from single or multiple sources and filter for events. Users can also suppress unnecessary fields from log messages.
SolarWinds Loggly
SolarWinds Loggly is an enterprise-class SaaS solution for log management and analytics. It’s part of SolarWinds application performance monitoring (APM) tools, along with Papertrail, AppOptics™, and Pingdom®.
Loggly offers powerful, agentless log ingestion capabilities from many different platforms and sources, as shown below:
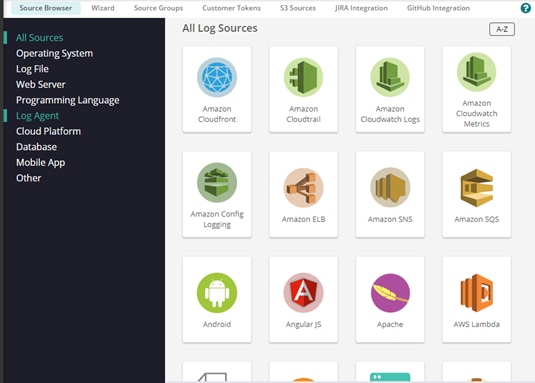
Once ingested, Loggly automatically parses logs, breaking them into individual searchable fields.
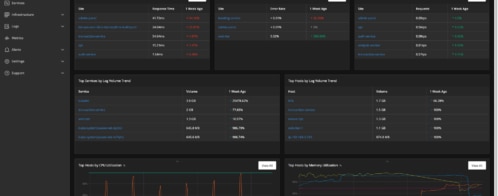
A powerful query capability allows users to create complex search queries, save those queries, and create charts and dashboards based on the query results. Loggly also offers an alerting mechanism and integration with notification channels like Slack or Teams. The image below shows a typical search screen in Loggly:
Other features of Loggly include anomaly detection, surround search, live tail, integration with GitHub and Jira, and shareable dashboards.
The Case for DigitalOcean Firewall Monitoring
A firewall is a mandatory component of any internet-facing application, and the DigitalOcean managed firewall is no exception. However, unlike host-based firewalls like IPTables or the systemd firewalld daemon, it’s not installed as a service within the VPS. DigitalOcean firewalls are network firewalls, which means they operate outside the VPS and can protect multiple VPS running similar applications. It also means traffic not allowed through the firewall cannot be detected from within the VPS and logged as blocked traffic.
This scenario leads to some interesting questions: how do operations teams know if a port is inaccessible or if a critical port was left open?
One way to address this in DigitalOcean is to create “probe traffic” from outside the VPS that tries to connect to the server and monitor traffic logs from the VPS itself. This way, if the VPS doesn’t log any messages for the incoming traffic, you’ll know the firewall is blocking the port. Similarly, if the VPS discovers unwanted traffic messages, the port is open in the firewall.
Test Environment Setup
Let’s look at an example using a simple setup: We have a single Droplet running in the DigitalOcean San Francisco data center. The Droplet is running WordPress 5.5 hosted on Apache web server running on Ubuntu 20. We used the one-click WordPress installation from DigitalOcean marketplace for the Droplet. Here’s the home page for the website:

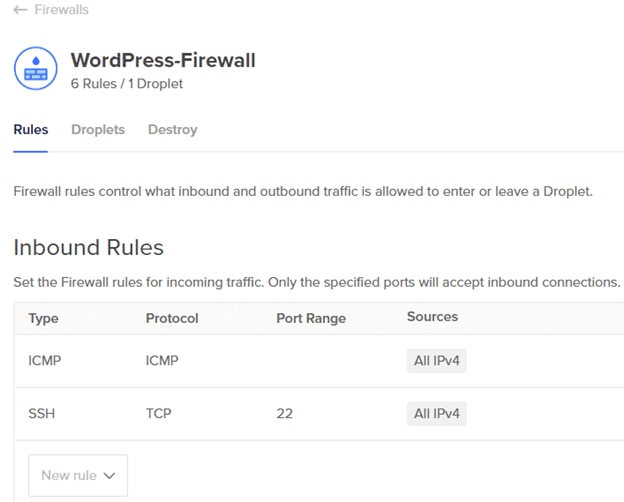
A DigitalOcean firewall is running in front of the Droplet. This firewall will allow only HTTP (port 80), ICMP, and SSH (port 22) traffic to the Droplet:
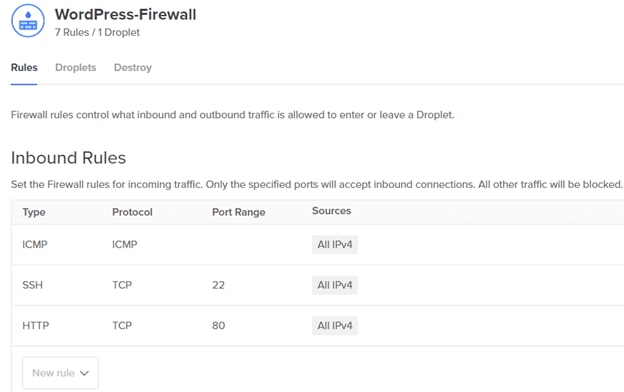
Although this is a simple setup, users can set up other rules in the firewall as well. Additionally, the same firewall can protect several other Droplets running WordPress.
Now let’s imagine the HTTP inbound rule was removed by accident. Our site would then become inaccessible. As the firewall blocks HTTP traffic, the Apache web server running in the Droplet wouldn’t know web traffic was denied access. This also means the access log wouldn’t contain any written messages.
Simulating Continuous Web Traffic
As system administrators, how can we know about this problem proactively before users report an outage?
To answer this question, we are simulating continuous web traffic from two locations. The first one is from another DigitalOcean Droplet running in its London data center:
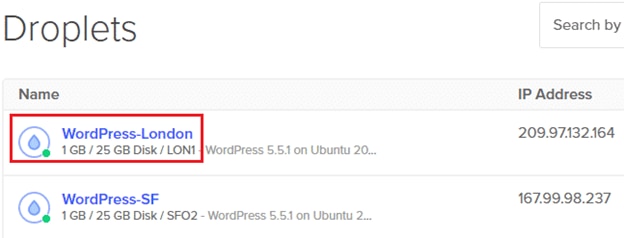
The London Droplet is not running behind the firewall; rather, it has a rudimentary shell script that accesses three pages from the San Francisco website:
#!/bin/sh

page1_url="http://167.99.98.237/"
page2_url="http://167.99.98.237/index.php/a-simple-page/"
page3_url="http://167.99.98.237/index.php/sample-page/"
curl -s $page1_url
sleep 10
curl -s $page2_url
sleep 10
curl -s $page3_url
A cron job calls the script every minute:
* * * * * /root/web_access.shWe have another scheduled job running every five minutes from our local Windows 10 workstation:
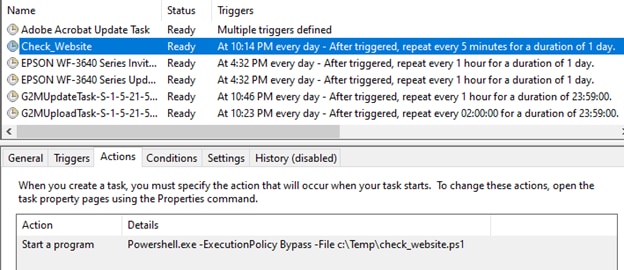
The scheduled task calls a PowerShell script that accesses the San Francisco website:
$webRequest = [net.WebRequest]::Create("http://167.99.98.237")
$webRequest.GetResponse().StatusDescription
When the firewall allows HTTP traffic, both these simulations will work, and the site will be accessible from both scripts. The Apache access log will also record the connections.
Now, the firewall also allows ICMP (or ping) traffic. To test this, we have scheduled another script from the cron job, running every minute and writing its output to a file:
* * * * * /root/ping_access.sh >> /var/log/ping.logThe script pings the server:
#!/bin/sh

ping -c 45 167.99.98.237
The ping log looks like the following. (We’re capturing the script file’s output in a log because the ping command does not have its own log.)
the ping command does not have its own log.)
64 bytes from 167.99.98.237: icmp_seq=42 ttl=55 time=140 ms
64 bytes from 167.99.98.237: icmp_seq=43 ttl=55 time=140 ms
64 bytes from 167.99.98.237: icmp_seq=44 ttl=55 time=140 ms
64 bytes from 167.99.98.237: icmp_seq=45 ttl=55 time=140 ms

--- 167.99.98.237 ping statistics ---
45 packets transmitted, 45 received, 0% packet loss, time 44074ms
rtt min/avg/max/mdev = 139.652/139.813/141.516/0.267 ms
PING 167.99.98.237 (167.99.98.237) 56(84) bytes of data.
64 bytes from 167.99.98.237: icmp_seq=1 ttl=55 time=142 ms
64 bytes from 167.99.98.237: icmp_seq=2 ttl=55 time=140 ms
64 bytes from 167.99.98.237: icmp_seq=3 ttl=55 time=140 ms
64 bytes from 167.99.98.237: icmp_seq=4 ttl=55 time=140 ms
64 bytes from 167.99.98.237: icmp_seq=5 ttl=55 time=140 ms
64 bytes from 167.99.98.237: icmp_seq=6 ttl=55 time=140 ms
64 bytes from 167.99.98.237: icmp_seq=7 ttl=55 time=140 ms
64 bytes from 167.99.98.237: icmp_seq=8 ttl=55 time=140 ms
64 bytes from 167.99.98.237: icmp_seq=9 ttl=55 time=140 ms
Setting Up Monitoring With Papertrail
With both probes working, we have configured Papertrail to receive the Apache access log from our website running on the Droplet in San Francisco.
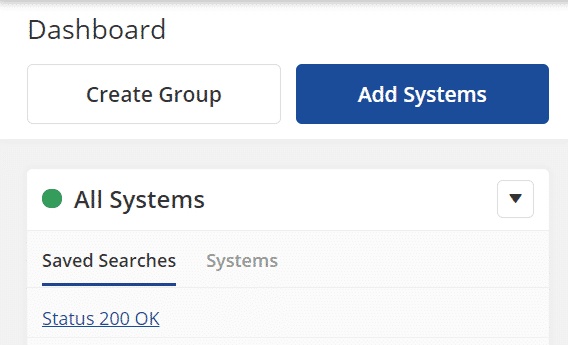
To do this, we clicked the “Add Systems” button from the dashboard screen and followed the prompts in the next screen:
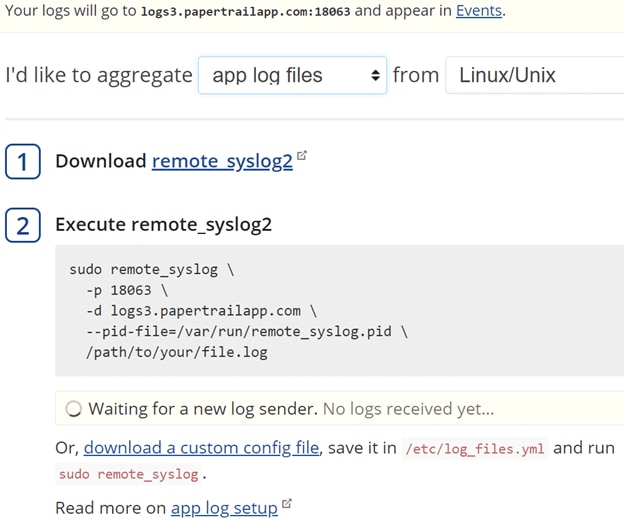
After installing remote_syslog2 from the SolarWinds GitHub repo, we created the following custom configuration file under the /etc directory of the web server Droplet:
files:
  - /var/log/apache2/access.log
destination:
  host: logs3.papertrailapp.com
  port: 18063
  protocol: tls
pid_file: /var/run/remote_syslog.pid
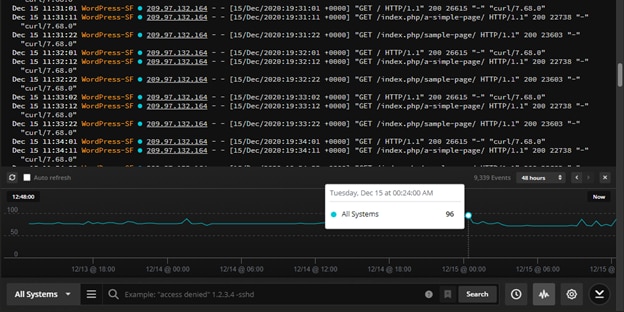
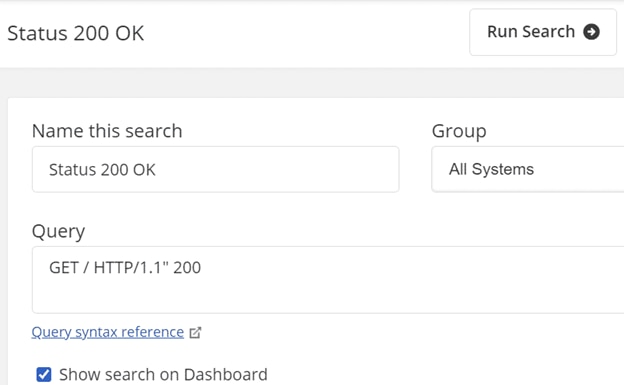
Finally, running the remote_syslog command started to stream the Apache access logs to Papertrail. We created a simple search condition to look for the message “GET / HTTP/1.1″ 200” from the logs:
The filtered log message appears in the Events screen:
Dec 16 03:51:12 WordPress-SF  209.97.132.164 - - [16/Dec/2020:11:51:12 +0000] "GET /index.php/a-simple-page/ HTTP/1.1" 200 22738 "-" "curl/7.68.0"
Dec 16 03:51:22 WordPress-SF  188.165.210.14 - - [16/Dec/2020:11:51:22 +0000] "GET / HTTP/1.1" 200 7389 "http://www.google.com.hk" "Mozilla/5.0 (Windows NT 6.1; WOW64) AppleWebKit/537.36 (KHTML, like Gecko) Chrome/42.0.2311.90 Safari/537.36"
Dec 16 03:51:22 WordPress-SF  209.97.132.164 - - [16/Dec/2020:11:51:22 +0000] "GET /index.php/sample-page/ HTTP/1.1" 200 23603 "-" "curl/7.68.0"
Dec 16 03:52:01 WordPress-SF  209.97.132.164 - - [16/Dec/2020:11:52:01 +0000] "GET / HTTP/1.1" 200 26615 "-" "curl/7.68.0"
Dec 16 03:52:12 WordPress-SF  209.97.132.164 - - [16/Dec/2020:11:52:12 +0000] "GET /index.php/a-simple-page/ HTTP/1.1" 200 22738 "-" "curl/7.68.0"
Dec 16 03:52:22 WordPress-SF  209.97.132.164 - - [16/Dec/2020:11:52:22 +0000] "GET /index.php/sample-page/ HTTP/1.1" 200 23603 "-" "curl/7.68.0"
Dec 16 03:53:02 WordPress-SF  209.97.132.164 - - [16/Dec/2020:11:53:02 +0000] "GET / HTTP/1.1" 200 26615 "-" "curl/7.68.0"
Dec 16 03:53:12 WordPress-SF  209.97.132.164 - - [16/Dec/2020:11:53:12 +0000] "GET /index.php/a-simple-page/ HTTP/1.1" 200 22738 "-" "curl/7.68.0"
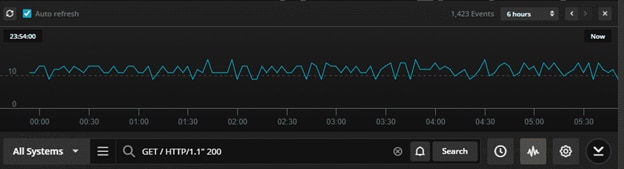
Papertrail can also display a simple graph showing the number of occurrences for the message:
Setting Up Monitoring With Loggly
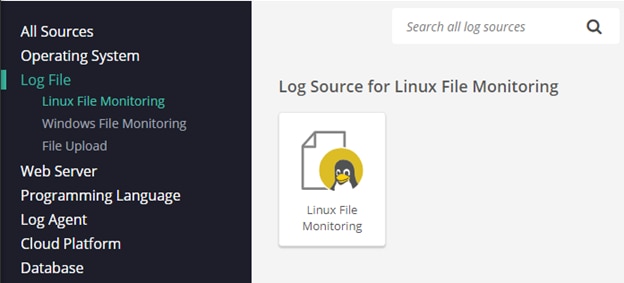
Loggly monitors the ping traffic log file (/var/log/ping.log) from the Droplet running in London. We have selected “Linux File Monitoring” from the “Source Setup” screen in Loggly:
We are also running commands like the following to stream the log file contents to Loggly:
curl -O https://www.loggly.com/install/configure-file-monitoring.sh

bash configure-file-monitoring.sh \
     -a <myacctname> \
     -t 1fxxxxxx-fxxx-46xx-xxc2-xxxxxx5da7xx
     -u <user_name>
     -f /var/log/ping.log -l ping
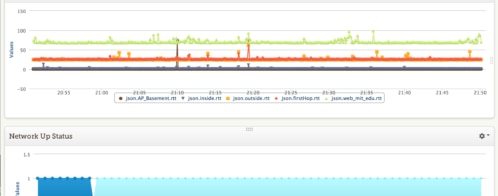
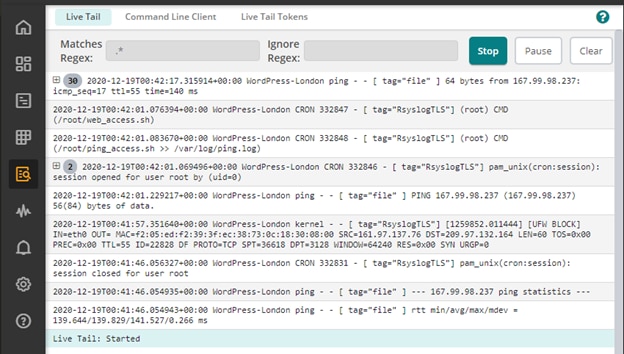
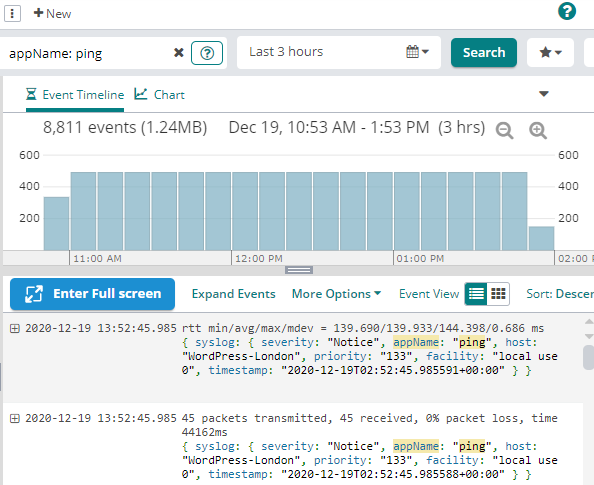
From the Loggly interface, we can see a “live tail” of the ping log’s contents:
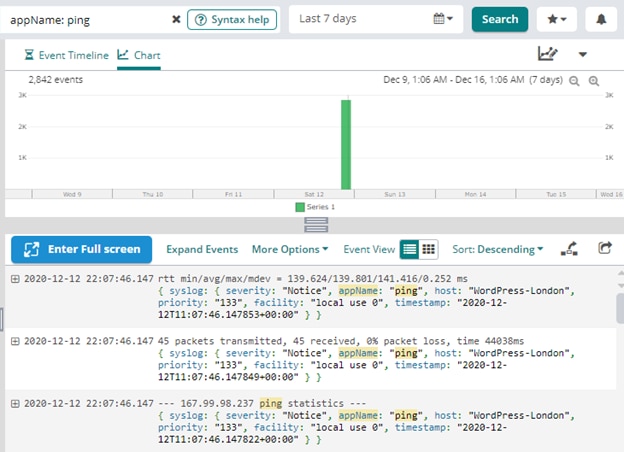
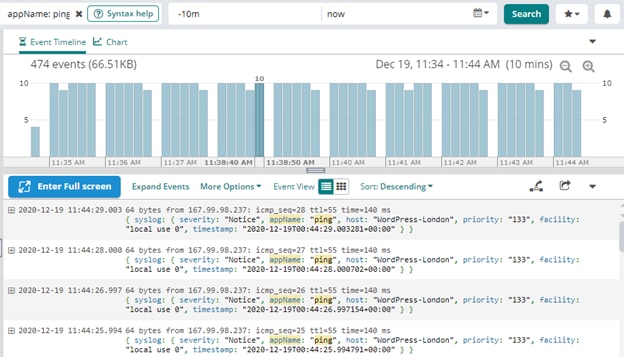
In the Loggly search screen, we can search for “appName: ping” and see the number of events happening over time:
Simulating a Firewall Issue
Our test setup graphs in both Papertrail and Loggly show both ICMP and HTTP traffic working.
Now, let’s say the DigitalOcean firewall has the HTTP port removed for some reason (perhaps by mistake or during an automated deployment):
The Papertrail and Loggly Solution
From the Event screen in Papertrail, we can see the number of HTTP 200 events captured in the Apache access log has decreased to zero:
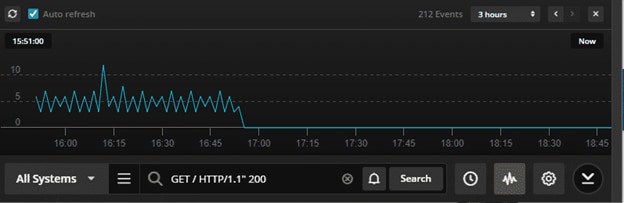
However, during the same time, the number of ICMP traffic messages has not decreased:
These two trend charts clearly show Papertrail is not receiving any HTTP events, but Loggly receives ICMP event logs. In other words, the Droplet in San Francisco is accessible using simple ping, but not HTTP.
A system administrator will typically start troubleshooting by looking at the Apache access and error log for any failure messages. Since the server won’t show any error messages related to a blockage or a reduction in web traffic, the investigation will quickly conclude HTTP traffic stops somewhere outside the Droplet. This can point to a network issue or a firewall. At this point, the administrator will test the firewall and likely discover the issue.
Conclusion
Application logs play a vital role in troubleshooting errors and outages. SolarWinds Loggly and Papertrail are two complementary platforms for capturing, storing, and managing logs from multiple sources. While Papertrail offers a quick and easy way to look at logs in real time, make correlations, and create persistent searches for insight, Loggly is geared more towards advanced use cases. Loggly can help you create more fine-tuned search criteria with Regular Expressions, identify anomalies, detect trends, and create charts or dashboards.
Setting up alerts in both Papertrail and Loggly is simple. They can immediately notify operations teams once the number of events in an open port flatlines. This can help system administrators become more proactive rather than reactive.
When it comes to monitoring firewall-protected applications in DigitalOcean, the combination of Papertrail and Loggly is an excellent choice for easy integration, proactive notifications, and root cause analysis.
The Loggly and SolarWinds trademarks, service marks, and logos are the exclusive property of SolarWinds Worldwide, LLC or its affiliates. All other trademarks are the property of their respective owners.

Loggly Team