Using Loggly to Monitor Your Logs for Performance Problems
For many web applications, slow performance can be as bad as no performance. Customers get frustrated, they abandon their transactions, and your business suffers. Today, I’m going to share some tips about how to monitor your logs for performance problems using Loggly. I’ll cover:
- How to log performance data to Loggly
- How to visualize it
- How to save your visualizations in a dashboard
I’ll show you how to monitor request time from an Apache application, but Loggly gives you many ways monitor your performance and system status.

Logging Performance Data to Loggly
The first step is sending your performance data to Loggly, and here are two easy ways:
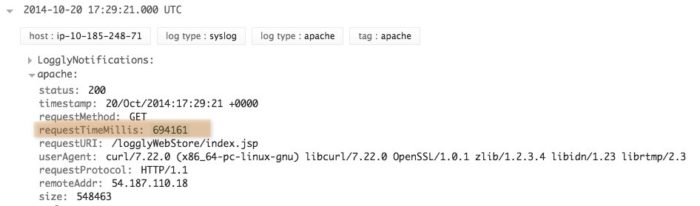
- Apache or Nginx Logs. Loggly automatically parses a number of log types, including Apache and Nginx logs. With these two types, your logs include response time as a field. You can see the example below with the requestTimeMillis field including the performance metric. In this example, Apache is actually configured to send the time as microseconds, so this response took .69 seconds.
- JSON Logs. You can create custom fields in your logs where you send metrics as JSON. This is a great approach because you can send both from the server or client side using your favorite logging method.
Visualizing Performance Data in Loggly
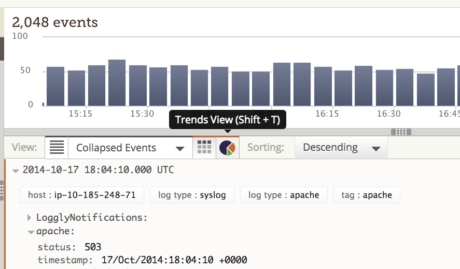
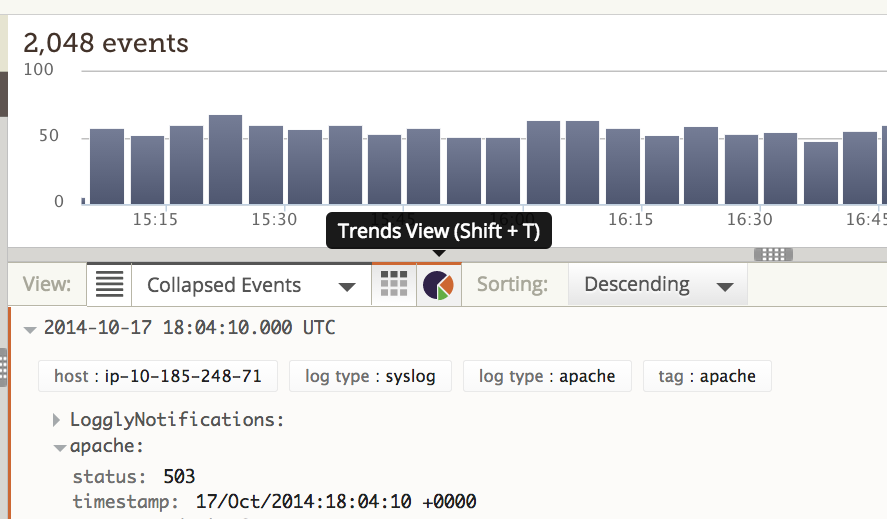
Now that you have configured your logs to send numeric information to Loggly, the next step is to visualize it. You can do that right from the search page using our Trends feature.
- From your search results screen, click on the pie chart icon below the event graph to open the trends view.
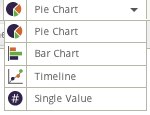
- Upon clicking, you’ll be able to choose your trend type: pie chart, bar chart, timeline or single value. (Note that you have to click on the second pie chart listed in order to select that option.) For performance data, I find the timeline view to be the most useful visualization.
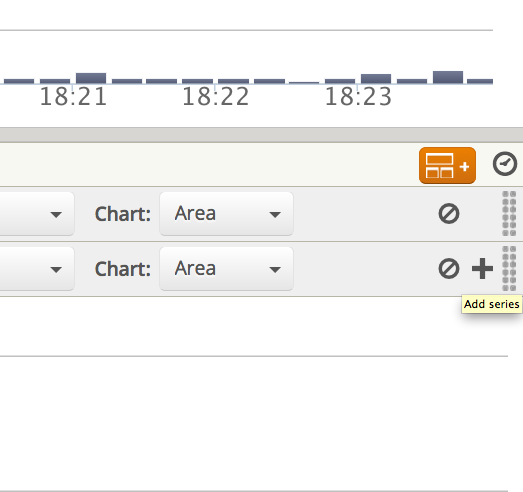
- Use the drop-downs below the chart type selection to choose the performance metric you want to graph (in my example, requestTimeMillis) and the statistic type (in my example, the average) in our interface. You can also choose a chart type on the right-hand side. I like area charts because they’re easy to read.
- You may want to look at more than one data series on the same chart. In the example below, I included both average response times and maximum response times so that I could quickly identify any big outliers. You add values by clicking on the + sign at the right-hand side to add a series.
My visualization looks like this:

Pretty useful! The spike at the beginning is showing that it took longer to process requests while Tomcat was starting up. I’m glad to see that once the service completed its restart, it’s performing pretty consistently.
How to Monitor Your Visualization in a Log Dashboard
If you want the view you created to be available for inclusion on your custom dashboard, you click the orange button on the right-hand side of the Trends toolbar (![]() ) to Save as Dashboard Widget. (Custom dashboards are a feature of Loggly trials and paid plans.)
) to Save as Dashboard Widget. (Custom dashboards are a feature of Loggly trials and paid plans.)
Then, you follow these steps.
- On the Dashboard page, click the
 button to add a new dashboard.
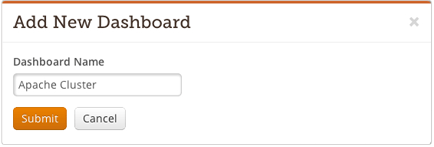
 - When the “Add New Dashboard” pop-up shows, type in a name for your new dashboard and click “Submit”.
- Now start adding widgets (your trend graphs or saved searches). You can choose from any widgets that come with Loggly’s standard summary dashboard or ones that you create from the trends interface. The widgets you create yourself appear under “Custom Widgets”.

Staying on Top of Your Application’s Performance
Using the performance dashboard I created, I have a constantly updated reference point for how my application is performing. My whole team can stay up to date on system status.
Once I have a good idea of what’s “normal” by monitoring my Apache Response Time graph, I can generate an alert that looks for the condition and notifies me. (I’ll save this topic for another blog post.) With Loggly, you can be the first to know about performance problems, so that you can fix them before they have a negative impact on your business.
If you don’t already have a Loggly account, get Loggly now (no credit card needed!) and try this for yourself.
The Loggly and SolarWinds trademarks, service marks, and logos are the exclusive property of SolarWinds Worldwide, LLC or its affiliates. All other trademarks are the property of their respective owners.

Jason Skowronski
