Using SolarWinds Loggly With MongoDB New Structured Logs
Last month, MongoDB released v4.4 of their database; the new release contains several changes and improvements, but the introduction of structured JSON logging caught our eye, which makes it easier to extract valuable insights from the logs using products like SolarWinds® Loggly®. In this post, we’ll review how to get started sending your MongoDB logs to Loggly and some of the insights you can easily get from your server logs when you upgrade to the latest version.
Getting Started With MongoDB
Sending our MongoDB logs to Loggly is straightforward. To get started, we’ll follow the MongoDB Logging Setup instructions available in the Loggly documentation here.
If you’re in your Loggly environment, there’s also a link to the documentation available from the Source Browser page:

The instructions will configure rsyslog to send the default MongoDB file log to Loggly. If you’ve already configured rsyslog to send your syslog messages to Loggly, you can configure MongoDB to write its logs directly to syslog by setting the systemLog.destination option in your mongod.conf file. You can also adjust the verbosity of your server’s logs; the default option should work well for the most part here, but for monitoring slow queries against your server, you may want to adjust the operationProfiling.slowOpThresholdMs and operationProfiling.slowOpSampleRate options to control what queries are written to the log and at what frequency. In my test environment, I’ve set the slowOpThresholdMs to 0, so I log all queries, but in a production environment, it’s advisable to set this to a higher value or set the slowOpSampleRate to limit the performance impact of logging queries.
Analyzing Your MongoDB Logs
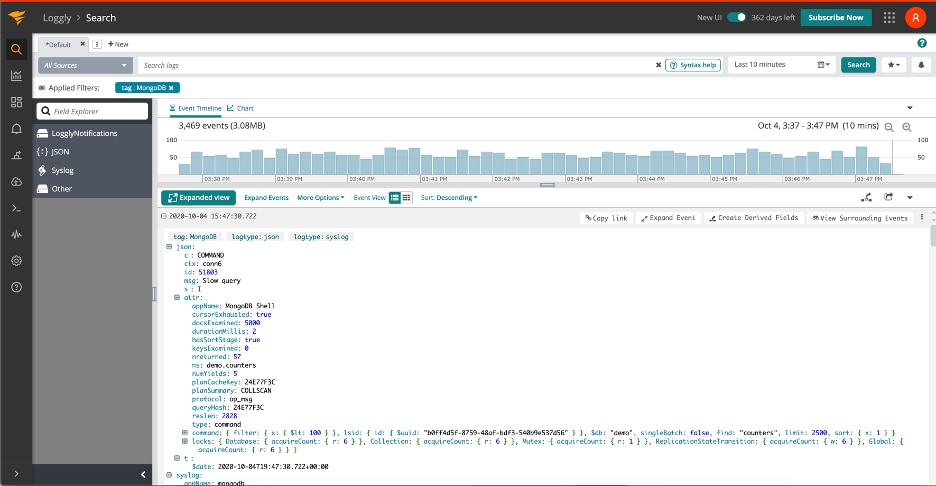
Now that you’ve gotten your MongoDB logs into Loggly, you should see something like this in the UI:

If you aren’t familiar with the information contained in MongoDB logs, the MongoDB documentation provides a fairly good overview; there’s a few useful things we’ll highlight here for analyzing our logs:
- s—this is the severity of the logged message; common values here are I (Info), W (Warning), E (Error), and F (Fatal).
- c—this is short for component; it tells us what the logged message is related to. For example, ‘NETWORK’ represents network-related activities, such as client connections to the server being opened/closed. For a full list of components, refer to the MongoDB Documentation here.
- ctx—short for context, this tells us about the thread the log line is related to. In most cases this will be a connectionID. You can filter on a specific context to get all the messages related to the thread in the server’s log.
The above attributes are common to just about every message logged by the server—in addition, a few attributes included in the logs can be specific to a given type of message. Let’s look at some of the useful bits of information we can get from slow query messages, such as the one in the screenshot above:
- appName—this tells us the name of the application that connected and ran the query.
- ns—the namespace (db.collection) a query ran against.
- docsExamined—how many documents the query examined; we can use this to help find inefficient/expensive queries.
- nreturned—how many documents the query returned; along with docsExamined, this lets us understand how efficient a given query is.
- durationMillis—how long the query took to run in milliseconds.
- hasSortStage—this tells us if the server had to sort the query results manually, rather than relying on the sorted order of an index on the collection being queries.
- planSummary—this property gives us a high-level view of the query’s execution plan; common values would be IXSCAN { <filter> }, or COLSCAN if the query didn’t use an index. This allows us to specifically search for queries that did not use an index.
- queryHash—This helps us identify queries with the same shape—queries with the same predicate, sort, and projection. We can analyze slow queries grouped by the queryHash to quickly understand how many different types of queries we’re seeing and which ones are most expensive to run.
The above is by no means a complete list of attributes, but it provides a good starting point for analyzing our database’s slow queries. Because the v4.4 release of MongoDB uses structured logging, Loggly will automatically parse all the fields and allow us to quickly search, aggregate, and visualize our database’s slow queries in many interesting ways. For example, since collection scans are an inefficient operation, we can search to see all slow queries logged that did a collection scan and examined at least 1000 documents. This would be via a search filter like this:
json.attr.planSummary:”COLLSCAN” AND json.attr.docsExamined: >=1000

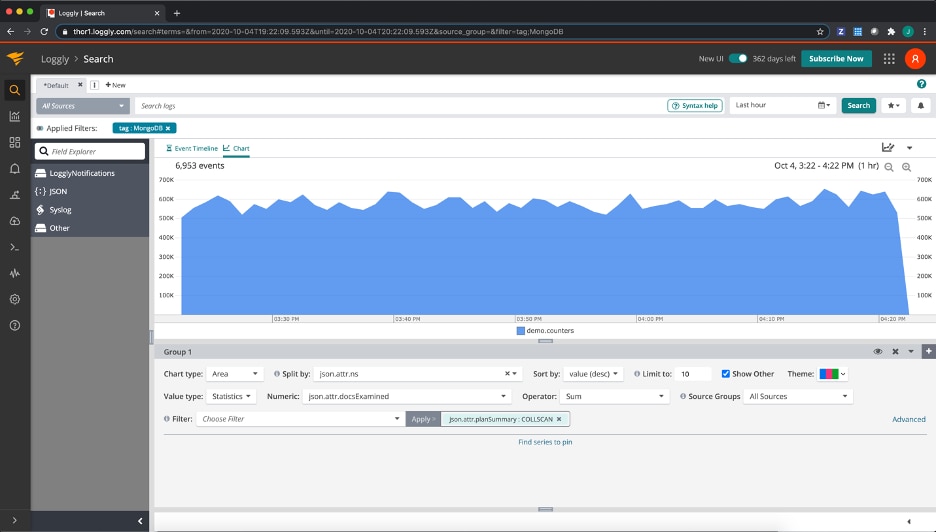
Or, if we want to do an impact analysis for the total number of documents examined by slow queries that performed a collection scan, broken down by the namespace they ran against:

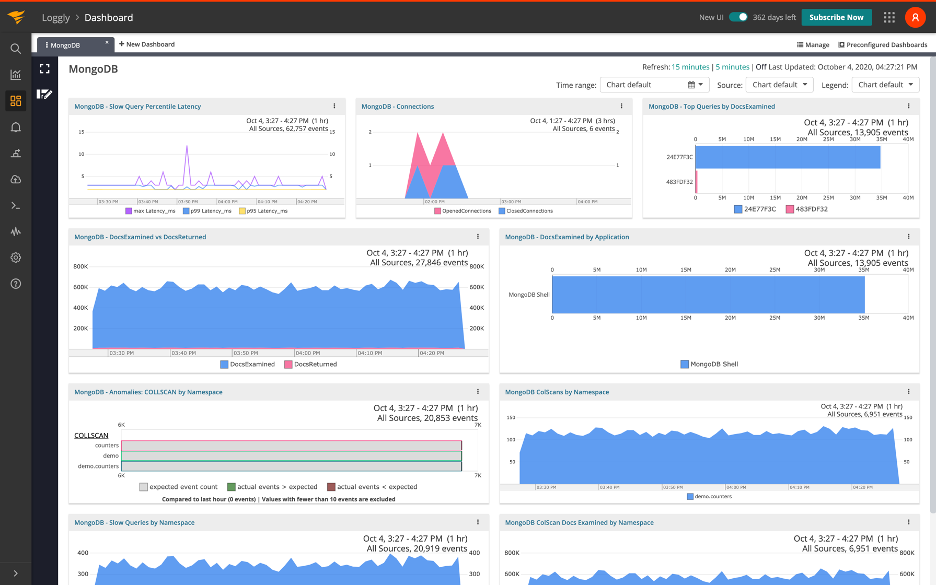
Combined with MongoDB v4.4’s new structured log output, the Loggly search, alert, and dashboard capabilities makes it easier than ever to get the critical operational insights we need to have into our MongoDB databases, so unexpected problems or inefficient queries can be quickly found and fixed. I’ve included a screenshot of the dashboard I set up for my MongoDB instance below for inspiration—if you’re interested in learning more about how SolarWinds Loggly can help you with your systems, send us a message, or sign up for a free 30-day trial today.

The Loggly and SolarWinds trademarks, service marks, and logos are the exclusive property of SolarWinds Worldwide, LLC or its affiliates. All other trademarks are the property of their respective owners.

John Potocny


