How We Monitor Elasticsearch With Metrics and Logs

As an architect at SolarWinds, it’s essential to work with our own monitoring tools as a form of quality control and source for innovation. As one of the largest players in the IT monitoring and management world, we’re always thinking about ways to make it seamless for customers to work across our suite of tools.
One of those tools I’ll focus on today is SolarWinds® Loggly®—our log management and analytics product, which is also a part of our APM integrated experience.
Loggly uses Elasticsearch as the primary storage and search engine for all the log data it processes. Loggly runs a large Elasticsearch environment composed of the following:
- 40 clusters
- ~2,000 nodes in total
- ~1,700 data nodes
- ~37,000 indices
- ~325,000 shards
- ~1,800,000,000,000 log events stored
- ~3,350,000,000,000,000 byte storage size (~3PB)
To effectively manage such a large environment, you need solid monitoring coverage with a robust system of performance metrics, logs, and alerts. In this post, I’ll detail some ways we set up Elasticsearch metrics with our systems to help show how you can set up monitoring for Elasticsearch in your own environment.

What Is Elasticsearch?
Based on the Apache Lucene library, Elasticsearch is an open-source search and analytics engine used across a wide range of use cases and industries—and it’s quickly emerged as one of the most popular enterprise search engines.
Elasticsearch Metrics Types Explained
Metrics serve as the primary source of information for your environment’s health. All the metrics we collect are sent to SolarWinds AppOptics™, an application performance monitoring solution with great capabilities for metrics processing, visualization, and alerting. Each metric is tagged with the Elasticsearch cluster ID, environment, cluster node name, and physical host identifier. This tagging allows us to effectively aggregate, drill down into, and inspect metrics in AppOptics.
Metrics can tell us how well individual clusters run, how much load they handle, whether there are any bottlenecks, and much more. The granularity of the metrics varies based on the scenario we need to cover, but we usually use three levels of detail: cluster metrics, node metrics, and data tier metrics.
Cluster Metrics
Cluster metrics are the top-level metrics we use to detect an issue with a given Elasticsearch cluster. The key Elasticsearch indicators we use are as follows:
- Cluster status
- /_cluster/stats – status field
Loggly reports cluster status (green, yellow, red) as a number in AppOptics to represent the top-level state of the clusters.
- Initializing/relocating/unassigned shards
- /_cluster/health – initializing_shards|relocating_shards|unassigned_shards
The number of shards in a given state is important for various scenarios:
- Having some initializing shards for a longer duration may mean the cluster can’t create a new index because it can’t assign new shards to available nodes.
- Having many relocating shards for a longer duration may point to an underprovisioned cluster unable to relocate data quickly enough. Each relocation affects the performance of target data nodes, so we always want the relocations to be as fast as possible.
- Having some unassigned shards for a longer duration may point to problems with one or more data nodes, such as a data node falling out of cluster and not being able to operate properly.
- Number of indices, documents, and shards
- /_cluster/stats – indices.count
- /_cluster/stats – indices.docs.count
- /_cluster/health – active_shards
These metrics aren’t a direct indicator of issues, but we use them when troubleshooting cluster performance issues to understand if there was a significant change in the number of documents, indices, or shards capable of impacting cluster performance and stability.
- Cluster state size
- /_cluster/state
Cluster state is a complete set of metadata about a cluster’s indices, shards, mappings, indexed fields, etc. If it grows too much, it may cause stability issues.
Additional Elasticsearch Node Metrics in Loggly
In addition to the key metrics provided directly by Elasticsearch, Loggly monitors services reading and writing to Elasticsearch using our own in-house services written in Java. We also use a great AppOptics Java SDK to report automatic and manual metrics directly to AppOptics. The metrics directly related to Elasticsearch are as follows:
- Batch flush time
We write data to Elasticsearch in batches containing up to a few thousand log events. The time it takes Elasticsearch to accept the whole batch is an important metric for troubleshooting performance issues.
The typical “healthy” value for batch flush time is in the order of tens—and at the most, hundreds—of milliseconds. If we see the flush time jumping to seconds, we immediately know we’re either pushing too much data to the cluster because it can’t handle the increased load, or there’s an issue with one or more ingest nodes in the cluster.
- Events/bytes indexed per second
The number of events and bytes indexed per second is a great metric we use to find out if a performance issue on the cluster is caused by the increased load—too many log events or too large log events—or if the incoming load is the same and the cluster is the problem.
Node Metrics
As mentioned at the beginning of this post, we run around 2,000 Elasticsearch nodes and collect around 70 individual metrics from each one. But thanks to the capabilities of AppOptics, we can still effectively inspect those metrics if we need node-level details.
Listing all the metrics here wouldn’t be fun to read, so let’s look at a few we often use when tweaking or troubleshooting Elasticsearch performance.
All the metrics are collected from the /_nodes/stats REST endpoint:
- Host CPU load: os.cpu.percent
This one is hopefully clear. CPU load on the node is a clear signal of whether the node is overloaded.
- JVM heap usage: jvm.mem.heap_used_percent
High heap usage leads to more garbage collection (GC) pressure, which then leads to slower responses and fewer log events indexed per second. This then leads to customers not seeing their data immediately and calling support, which leads to support escalating to engineering—which nobody wants. We really want to scale our Elasticsearch clusters, so each data node has enough memory to handle the load.
We generally aim to be below 75% because our experience shows Elasticsearch can operate without issues at up to 75% heap usage. Anything above 75% starts impacting node performance and cascades to the whole cluster.
- GC statistics: jvm.gc.collectors.young|old.collection_count and jvm.gc.collectors.young|old.collection_time_in_millis
Garbage collection can significantly slow down the whole Elasticsearch node, so keeping GC counts and times low is essential. This metric tells us if GC is the issue.
- Query time: indices.search.query_time_in_millis
This metric tells us how much time the given node spent running queries. We usually don’t look at this metric for a single node but use it to compare the values between all the nodes in the cluster. Doing so helps us find underperforming nodes or nodes queried more than others, which may be caused by unbalanced indexes. Unbalanced indexes occur when shards of an index aren’t spread evenly across all nodes.
- IOPS: fs.io_stats.total.read_operations and fs.io_stats.total.write_operations
I/O is one of the bottlenecks capable of ruining the query performance on an Elasticsearch cluster. If a query needs to scan through GBs or even TBs of data stored on given data node, it can easily hit the IOPS limit. This is especially true in the case of cloud storage, which may have lower IOPS limits depending on the storage capacity and tier.
- Index throttling: indices.indexing.is_throttled
Elasticsearch is constantly doing many things when you index new data into it. If for some reason the background processing of newly indexed data can’t keep up with the amount of new data coming in, Elasticsearch starts throttling the indexing rate to relieve the pressure. This metric shows us if this happens, so we immediately know the node can’t handle the amount of data we’re throwing at it and we may need to scale up if this situation lasts longer.
You can use many other node metrics Loggly collects to troubleshoot performance, but in most cases, we only use them to compare multiple nodes in the cluster to identify outliers with underperforming nodes and underlying hardware issues.
Data Tier Metrics
Loggly uses two “data tiers” for all the logs it stores, and our Elasticsearch node metrics are further split into two categories: hot and cold.
The hot tier is for current logs up to a certain age. These logs are stored on the most powerful machines with super-fast disk arrays to provide the best experience for customers. The vast majority of Loggly queries customers run are for current logs over the last few hours or days. This is where we need to provide the best possible performance.
The cold tier is for logs older than a certain age. These logs are stored on machines with much larger disk arrays optimized for effective long-term storage, but they’re a bit slower than hot arrays. The queries for older logs are much less frequent, so the cold nodes don’t handle as much load. This way, we can provide great service at a reasonable cost to our customers.
When we troubleshoot indexing performance or “current logs” queries, we care only about hot metrics, as they’re from the nodes handling all the incoming logs. When we troubleshoot the performance of long historical queries spanning days or weeks of data, we focus more on cold metrics, as they’re from the nodes holding historical data. These two categories are usually quite different because the load on these two categories of nodes is also different.
Collecting Elasticsearch Logs
Aside from defining these Elasticsearch metrics, we also collect logs from our Elasticsearch clusters and send them to our own internal instance of Loggly (yes, we use Loggly to monitor Loggly).
If we identify an Elasticsearch cluster or node having some issues via metrics, we use logs to find out what’s happening on the node, what’s affecting cluster health, and how to fix the problem.
A Path to Full-Stack Observability
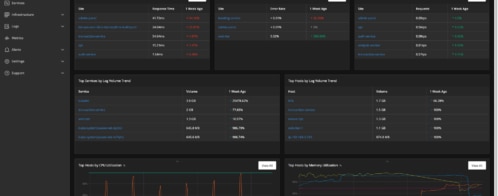
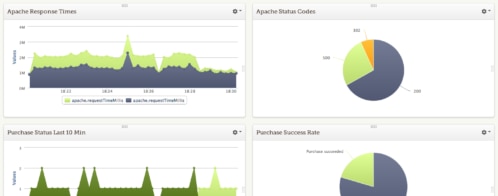
Properly monitoring our Elasticsearch clusters is a crucial aspect of our quality of service for Loggly. Using the proper tools—such as AppOptics and Loggly—makes this task easier by allowing us to collect, store, and process huge amounts of metrics and logs from our environment. Additionally, building proper dashboards can make it easier to visualize the data and find the root cause of issues faster.
For even deeper visibility, the SolarWinds APM Integrated Experience is designed to integrate user, metric, trace, and log data from SolarWinds Pingdom®, SolarWinds AppOptics, and SolarWinds Loggly into a central interface. You can also learn more about the benefits of achieving observability using the APM Integrated Experience or get started with a free trial.
The Loggly and SolarWinds trademarks, service marks, and logos are the exclusive property of SolarWinds Worldwide, LLC or its affiliates. All other trademarks are the property of their respective owners.

Jiri Tomek Jiri started coding in elementary school and wrote in several languages throughout his educational career. After receiving a master’s degree from the Brno University of Technology in 2009, Jiri joined SolarWinds and worked on many of the Orion®️ Platform products, which resulted in both patent applications and a fast promotion to Principal Developer. Most recently, Jiri has been working on SolarWinds SaaS products.