How to Monitor Full-Stack Django Applications
Introduction
Modern web applications can be complex. A typical application stack usually involves several components spread across different layers. For example, HTML5 and AngularJS can make up a site’s front end. User inputs and queries from the front end can be passed on to containerized microservices running on a middleware, which in turn could pass the queries to a back-end database. Systems like WAFs and LDAP servers can be used for security and authentication. The underlying cloud-hosted infrastructure would add to the complexity, as it too would be code-based.
This loosely coupled architecture offers flexibility and fault tolerance. However, it also means full-stack applications have many moving parts, and any of these parts can malfunction at any time. For operations teams, monitoring a modern application often involves using different tools. These can include infrastructure monitoring from the cloud provider, log management solutions, network monitoring probes, database metrics, or application performance monitoring tools (APM tools).
Each software has its strengths, but piecing together bits of information from each source can waste valuable time during an outage.
But what if all these monitoring tools were all native to one another and part of an integrated suite? What if they could seamlessly work together and share information?
That’s what the SolarWinds APM Integrated Experience offers. In this article, we’ll see how it can monitor a web application.
The Scenario
For our test case, we created a Django-based website hosted on the DigitalOcean cloud platform.
What Is DigitalOcean?
DigitalOcean offers cost-effective virtual private servers (VPS) and is widely popular in the development community. It provides various services for rapid end-to-end development, testing, and deploying distributed applications. One of these features is the DigitalOcean Marketplace.
The Marketplace contains many “one-click applications,” which are images of pre-installed packages like WordPress or Magento. Developers can deploy these applications on DigitalOcean virtual servers (Droplets) or Kubernetes clusters. One such image is the Django framework running on Ubuntu 20.04.
What Is Django?
Django is an open-source, Python-based web framework for rapid web development. It comes with several components to build maintainable, scalable, secure, and robust websites. Django’s main strength is its modularity and its ability to work with different client-side frameworks and back-end databases. Many well-known websites are powered by Django, including YouTube, Instagram, Spotify, Dropbox, and Pinterest.
What Is the SolarWinds APM Integrated Experience?
The APM Integrated Experience provides end-to-end observability across custom on-premises, cloud, and hybrid systems and applications—client side and server-side—in a single, integrated experience. The APM Integrated Experiences offers
- Infrastructure and Application Monitoring Powered by SolarWinds AppOptics™. AppOptics provides application performance monitoring tracing and custom metrics for hybrid and cloud-custom applications.
- Log Management and Analytics Powered by SolarWinds Loggly®. Loggly offers a hosted, scalable, full-stack log management solution that can collect, store, analyze, and visualize logs from multiple sources.
- Digital Experience Monitoring Powered by SolarWinds Pingdom®. Pingdom provides web application and monitoring to find and fix performance and availability issues to help ensure a seamless end-user experience.
DigitalOcean, Django, and SolarWinds
Our test scenario deployed DigitalOcean’s one-click Django application on a Droplet (virtual server). This machine runs Ubuntu 20.04, has Nginx and uWSGI preinstalled, and has a default Django site.
Rather than using the default website, we created our own Django project and a simple app. Although Django uses SQLite as its default database, we configured it to use a DigitalOcean-managed PostgreSQL instance.
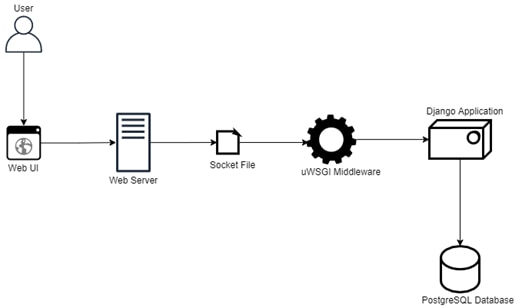
Both Nginx and Django interfaced with uWSGI to “talk” to each other. uWSGI is an implementation of the Web Server Gateway Interface (WSGI) standard and works as a middleware here. Nginx can’t directly talk to Django; it needs a middleware to send client requests to the application. The application sends its responses back to uWSGI, which passes the results back to Nginx. Nginx and uWSGI communicate via a Unix socket file.
The simplified architecture is shown below:
We used AppOptics, Loggly, and Pingdom to monitor the site.
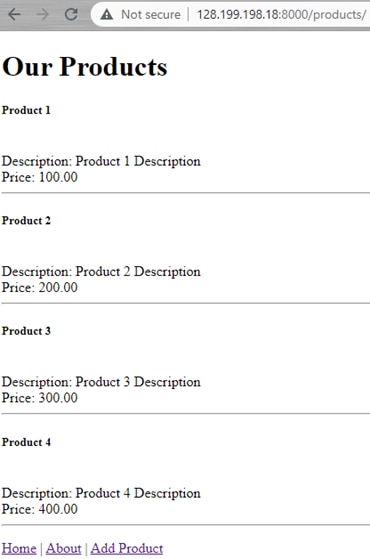
The Django Application
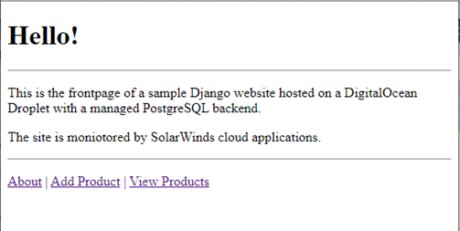
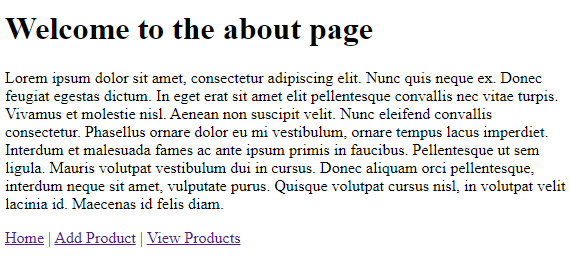
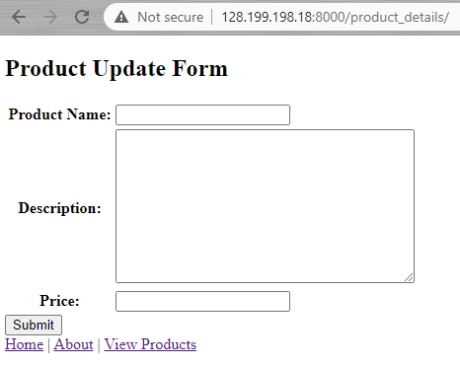
The Django project is a simple online product catalog with four pages linked to one another: the home page, the “about” page, the online product form, and the product catalog page. The online form and the catalog page read data from the PostgreSQL database.
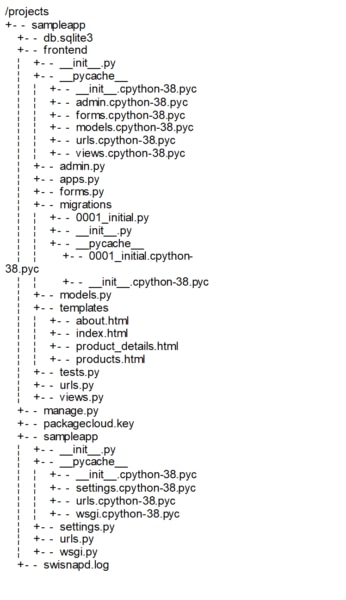
The Django project is called “sampleapp,” and the site was served by an app called “frontend.” The project’s structure is shown below.
We configured the project’s settings.py file to use a PostgreSQL database called django:
DATABASES = {
    'default': {
        'ENGINE': 'django.db.backends.postgresql_psycopg2',
        'NAME': 'django',
        'USER': 'doadmin',
        'PASSWORD': '<password>',
        'HOST': 'django-do-user-842439-0.b.db.ondigitalocean.com',
        'PORT': '25060',
        'SSL': 'require',
    }
}
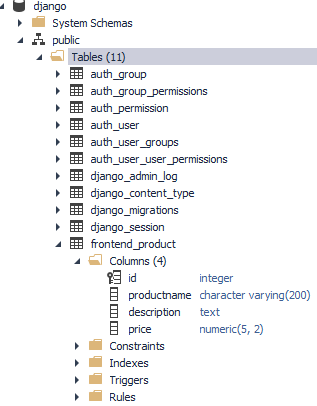
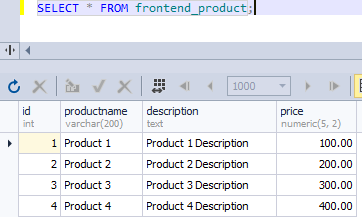
The database had our product table (apart from the Django system tables):
The uWSGI service configuration is shown below. Its socket file (sampleapp.sock) was created in the /tmp directory:
[uwsgi]
project = sampleapp

chdir = /projects/sampleapp/sampleapp
wsgi-file = /projects/sampleapp/sampleapp/wsgi.py
module = sampleapp.wsgi:application

master = True
processes = 4

socket=/tmp/sampleapp.sock
pidfile=/tmp/sampleapp.pid

chown-socket = www-data:www-data
chmod-socket = 664
vacuum = True

logto = /var/log/uwsgi/sampleapp.log
env = DJANGO_SETTINGS_MODULE=sampleapp.settings
The Nginx available site configuration (/etc/nginx/site-available-sites/sampleapp) had a pointer to the uWSGI socket file. It was also configured to run our site at port 8000:
server {
    listen 8000;
    server_name 128.199.198.18;

    location = /favicon.ico { access_log off; log_not_found off; }

    location / {
        include         /etc/nginx/uwsgi_params;
        uwsgi_pass      unix:///tmp/sampleapp.sock;
    }
}
Configuring the SolarWinds APM Integrated Experience
We then set up SolarWinds AppOptics, Loggly, and Pingdom to point to our site.
Setting Up AppOptics Monitoring
AppOptics configuration involves installing the APM agent package, setting an environment variable, and adding the agent application as a middleware to the Django settings.py file.
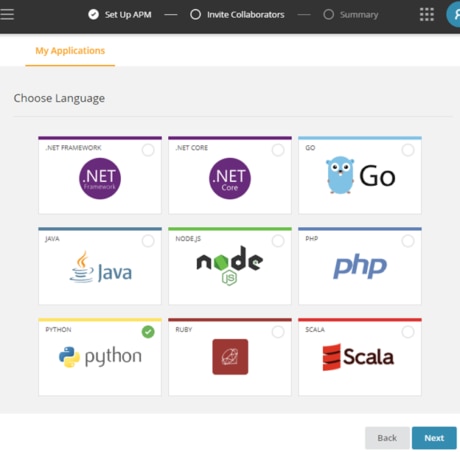
To set up Django monitoring, we selected Python from the “Set up APM” > “Choose Language” page:
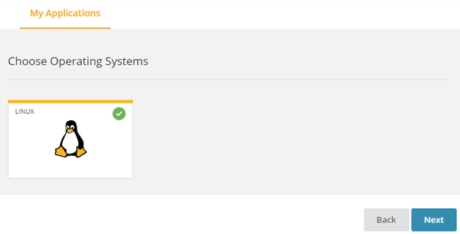
Then chose the operating system:
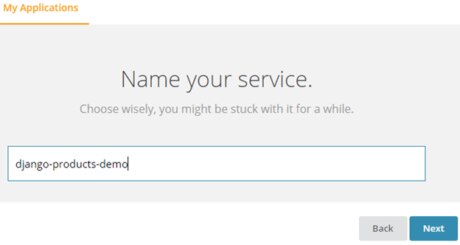
Named our service:
And finally, followed the instructions on the last page of the wizard to install and configure the AppOptics Python agent:
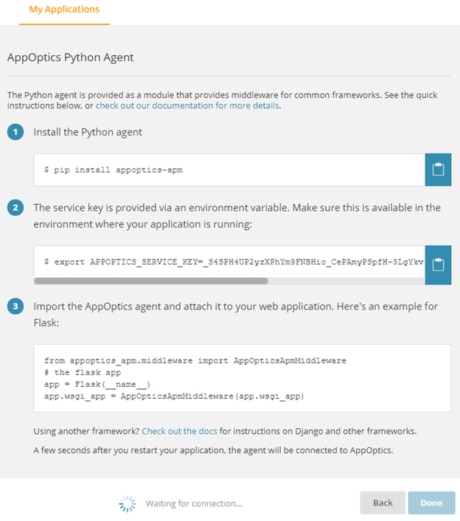
AppOptics documentation has more information about setting up Python monitoring. The Django project’s settings.py file was updated to include the Python agent:
INSTALLED_APPS = [
    'django.contrib.admin',
    'django.contrib.auth',
    'django.contrib.contenttypes',
    'django.contrib.sessions',
    'django.contrib.messages',
    'django.contrib.staticfiles',
    'frontend',
    'appoptics_apm.djangoware',
]
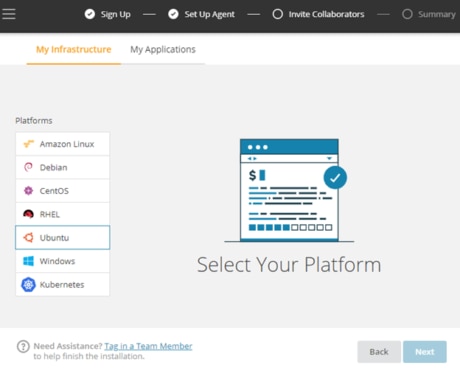
After setting up Django, it was time to onboard the infrastructure. We chose Ubuntu as the platform:
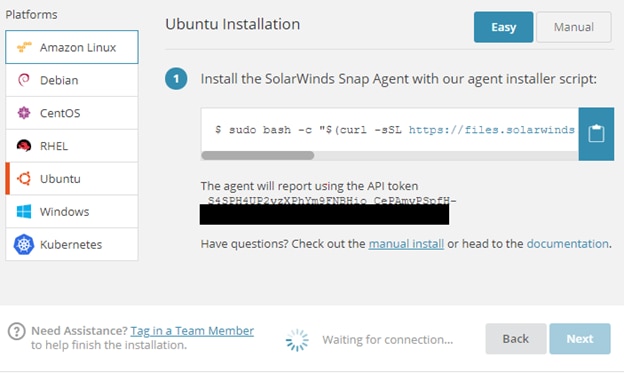
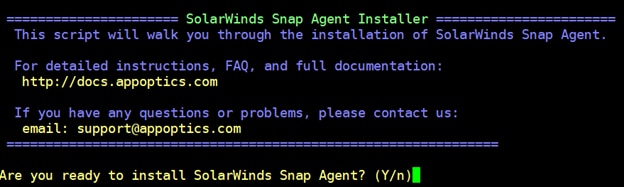
And followed the instructions to install the snap agent:
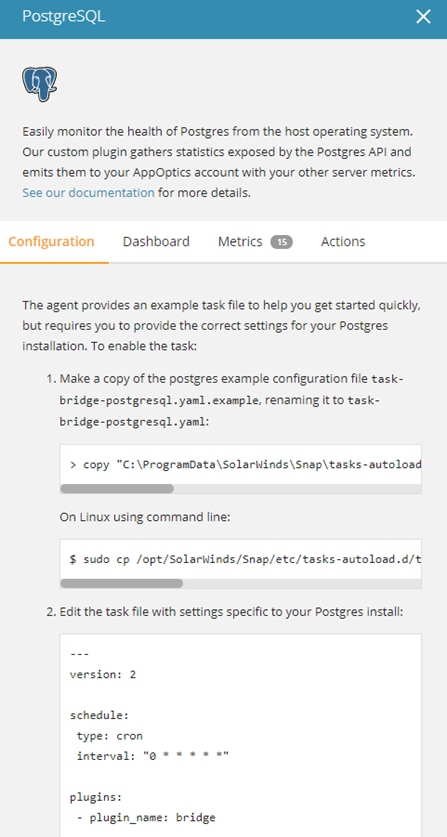
Finally, the PostgreSQL plugin was enabled:
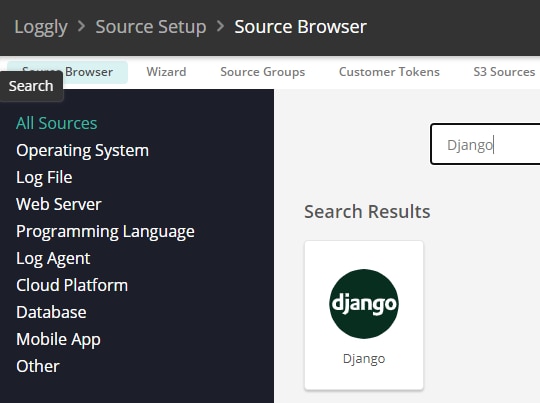
Setting Up Loggly Monitoring
We configured our Loggly account to collect logs for Django, Nginx, and uWSGI. Setting up a Loggly data source involves downloading a custom bash script for the source and running the script with the Loggly subdomain, account name, and customer token.
For Django, Loggly collects its events from the Syslog and requires changing the Django project’s setting.py file:
LOGGING = {
  'version': 1,
  'disable_existing_loggers': False,
  'formatters': {
    'django': {
      'format':'django: %(message)s',
    },
  },
  'handlers': {
    'logging.handlers.SysLogHandler': {
      'level': 'DEBUG',
      'class': 'logging.handlers.SysLogHandler',
      'facility': 'local7',
      'formatter': 'django',
      'address' : '/dev/log',
    },
  },
  'loggers': {
    'loggly_logs':{
      'handlers': ['logging.handlers.SysLogHandler'],
      'propagate': True,
      'format':'django: %(message)s',
      'level': 'DEBUG',
    },
  }
}
Loggly documentation shows more information about setting up a Django log collection.
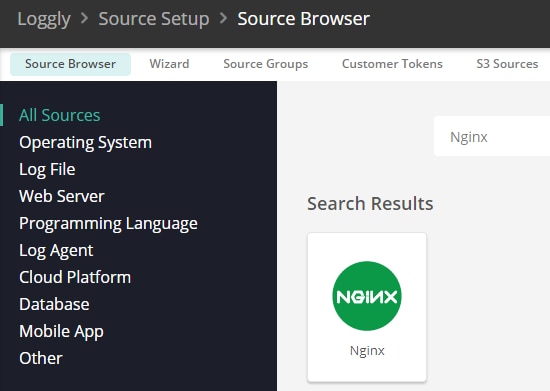
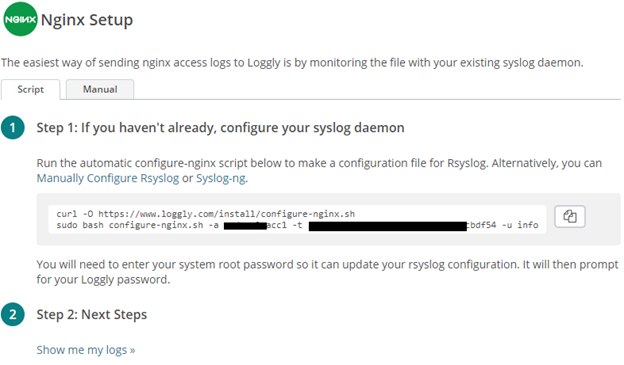
Setting up Nginx log collection involved two steps:
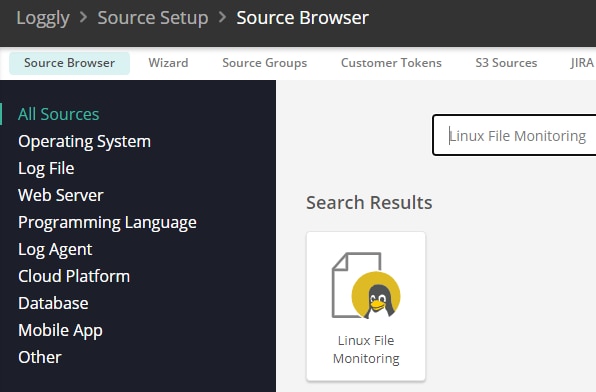
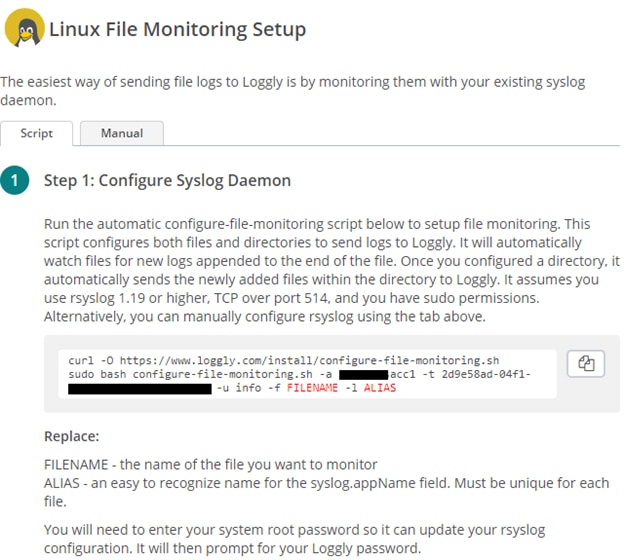
And finally, the uWSGI log collection involved using the generic Linux file monitoring source:
Setting Up Pingdom Monitoring
There are four probes available in Pingdom, and we used three of those to check the site’s availability and its speed:
- Visitor insights (real user monitoring or RUM)
- Uptime
- Page speed
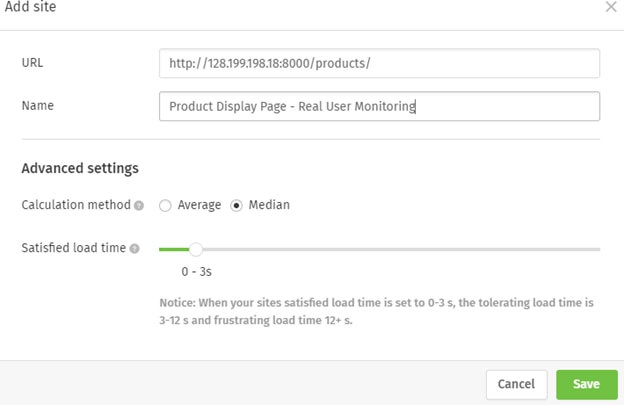
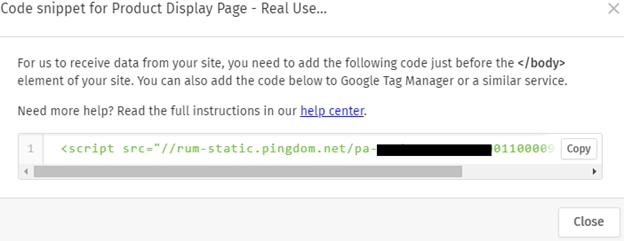
For real user monitoring, we had to add JavaScript to the page we were monitoring:
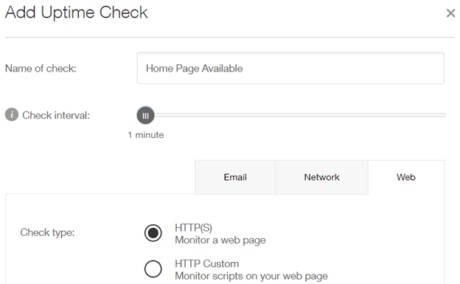
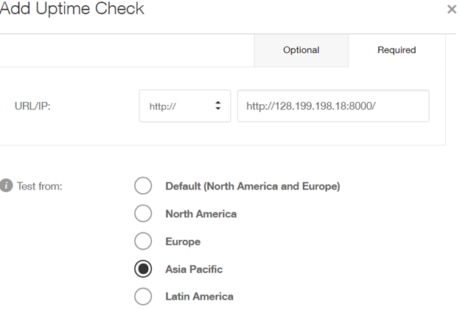
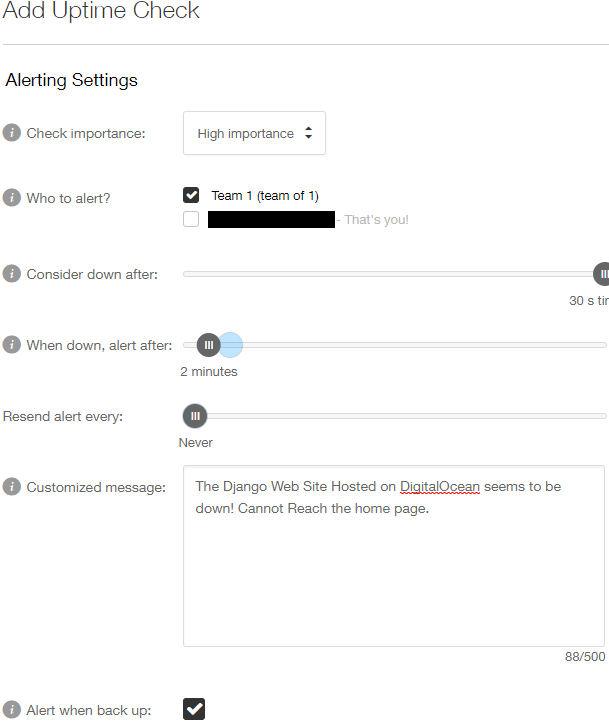
Checking the uptime of the home page required several parameters:
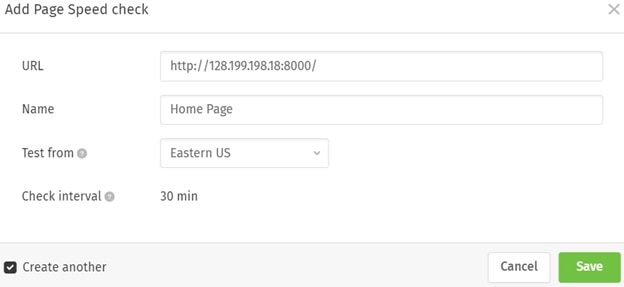
The page speed check was easy to set up as well:
Wrapping Up Part 1
To test different monitoring options for modern web applications, we deployed a Django application on a DigitalOcean Droplet. We created a custom Django project and a simple application to exercise different monitoring functions. We then set up the SolarWinds APM Integrated Experience by installing AppOptics application and infrastructure monitoring, Loggly log management, and Pingdom web monitoring.
In part 2, we’ll create an outage in our application and see how the monitoring tools react. Using the data from the outage, we’ll explore the types of metrics and alerts provided by each tool. Our goal is to determine if the APM Integrated Experience can be used to provide a holistic view of web application performance.
The Loggly and SolarWinds trademarks, service marks, and logos are the exclusive property of SolarWinds Worldwide, LLC or its affiliates. All other trademarks are the property of their respective owners.

Loggly Team