Monitor User Experience Using Client-Side JSON Logs
Logging is one of the most useful tools available for developers. It allows them to view and understand the inner workings of their application, even while it’s actively running. It is absolutely essential during development; hunting down bugs and broken points in a project would be impossible without it.
In a production build, logging is traditionally only performed on the server. Logs on the client side are stripped away for the final product, and if any remain, they are simply lost within the user’s browser—never to be seen again. This was all good and well when websites were generated on the server side, since most of the logic was handled on the server. The client performed an action, and the server sent back a whole new page to display the client’s changes.
However, with the rise of client-side rendering and SPAs, it’s becoming common for the frontend application to handle the vast majority of the user experience. Now more than ever, we need to leverage the benefits of logging on the client side to monitor problems in the user experience.
Importance of User Experience
One of the most essential aspects of any application or service is the user experience. Even with enticing marketing, beautiful modern designs, and a great idea, if the user experience suffers, then the app will likely suffer greatly as well. People remember how it feels to use the app, how it responds to their inputs, and how it adapts to their needs. By exceeding in these areas, the result should be a growing customer base that actively helps promote your app. People talk about their best and worst experiences, so it’s essential to be remembered as one of the best. Since user experience is so important, we must explore areas that we’re missing in terms of monitoring this data.
Current Frontend Culture
Of course, we can continue using the traditional methods of QA testing and asking for user feedback, but these methods fail to capture your entire audience. Client-side logging, however, helps solve this problem, but it hasn’t become part of frontend culture yet. This is because logging is typically thought of as being a server-side practice, and also because there haven’t been easy ways to achieve client-side logging in the past. On the server, it can be as simple as ‘console.log’, but using that method on the client will be lost in their browser. To actually collect and organize that data, you had to create a whole API and database to receive and store the logs from your clients. This adds a whole new layer of backend development and maintenance to your project, so it’s easy to see why it was rarely done.
Logging on the Client
Local vs. Remote
The two primary methods of logging are local and remote. Local logging on a server would involve saving log files to the same machine that the server is running on. Remote logging is a technique where logs are sent to a separate location for storage and analytics. On the client, local logging is really not helpful for an app in production. First of all, files cannot be automatically saved to users’ devices. Even if they could be, that wouldn’t help us discover issues and patterns that users experience. Therefore, to do effective client-side logging, we must use a remote logging strategy.
Methods of Remote Logging
HTTP Requests
A popular option for remote client-side logging is via POST or GET requests over HTTP. The client first starts buffering logs over a period of time. Then they are sent in bulk via a POST request to a server with an endpoint to handle these requests.
Tracking Pixel
We use tracking pixels to track user activity on websites, where we insert an extremely small 1×1 pixel image into the HTML of any page. This is especially used in cases where JavaScript is not allowed to be executed on the site, but even for your own site, tracking pixels can be very useful as a simple and fast way to track where users are going on your site.
“Bridge” App
Using a third-party service to bridge the gap between your clients and your logs can be one of the easiest and most effective way to capture user activity. Rather than rolling your own solution by building an API on a server that can handle POST requests or serve tracking pixels, you simply integrate the SDK of the bridge app into your own website and start logging immediately.
Plain Text vs. JSON Logs
Sending logs from the client to the server or service typically involves sending them as either plain text or JSON format text. Plain text may be the fastest to implement, but JSON allows for much more flexibility and power. By storing logs as plain text, you simply end up with a set of text to look through. However, with JSON, you can create a rich database full of fields that can be searched, filtered, and analyzed to fit your needs, a fantastic solution for finding the information you need very quickly.
A popular example of filtering with a JSON solution is to include a log level in the data, such as “ERROR”, “WARNING”, or “INFO”. You can filter logs based on the level of the log. If you are looking for errors, you can quickly filter out warnings and info logs and look directly for issues that are breaking your app. Of course, this is just a very basic, yet common example of the power of JSON logging.
Client-side Logging Libraries
A number of open-source logging libraries are available. One example is “loglevel” (https://github.com/pimterry/loglevel), which serves as a replacement for ‘console.log()’ to add additional features and fix some of the faults of browser logging. Together with the “loglevel-plugin-remote” plugin (https://github.com/kutuluk/loglevel-plugin-remote), this can make a really great solution for client-side logging to a remote server. Another option is “beaver-logger” from the PayPal kraken.js team (https://github.com/krakenjs/beaver-logger). Beaver logger supports sending buffered logs to a server.
Finally, Winston (https://github.com/winstonjs/winston), a very popular server-side logger, is working on building browser support. It already supports transporting logs to multiple different servers as needed, so this will be a great choice once they finish client-side support.
Introduction to SolarWinds Loggly
All of these strategies and libraries can work well, but they involve a great deal of extra work from your developers. Using an existing service built for the exact purpose of logging and monitoring allows for an easy-to-implement solution. SolarWinds® Loggly® provides one simple cloud service for all of your log analysis and monitoring. Loggly lets you proactively monitor and troubleshoot logs, provides DevOps integrations, and includes data analysis, reporting, and more. Essentially anything that logs can be integrated with Loggly for storage and analysis, including a front-end web application. For this purpose, Loggly has support for both HTTP request transfer and tracking pixels.
Sending Client-Side Logs to Loggly
We can use the excellent loglevel package to have much better control over our logging. To send these logs to Loggly, include the loglevel-plugin-remote package and call the “apply” function. This function applies a remote configuration to loglevel so that all future logs are also sent to Loggly. (Replace the “url” field with your URL from Source Setup > HTTP.)
<script src="https://unpkg.com/loglevel/dist/loglevel.min.js"></script>
<script src="https://unpkg.com/loglevel-plugin-remote@^0.6/dist/loglevel-plugin-remote.min.js"></script>

<script>

  remote.apply(log, {
    url: 'https://logs-01.loggly.com/inputs/ff2337d9-dd24-4030-8c6e-
309ae53738db/tag/http/',
    method: 'POST',
    format: remote.plain
  });

  log.error('test error');

</script>
This sends a log to Loggly in the form:
[2018-09-25T19:45:53.032Z] ERROR: test error at https://127.0.0.1:8080/:18:11Creating an Error Chart
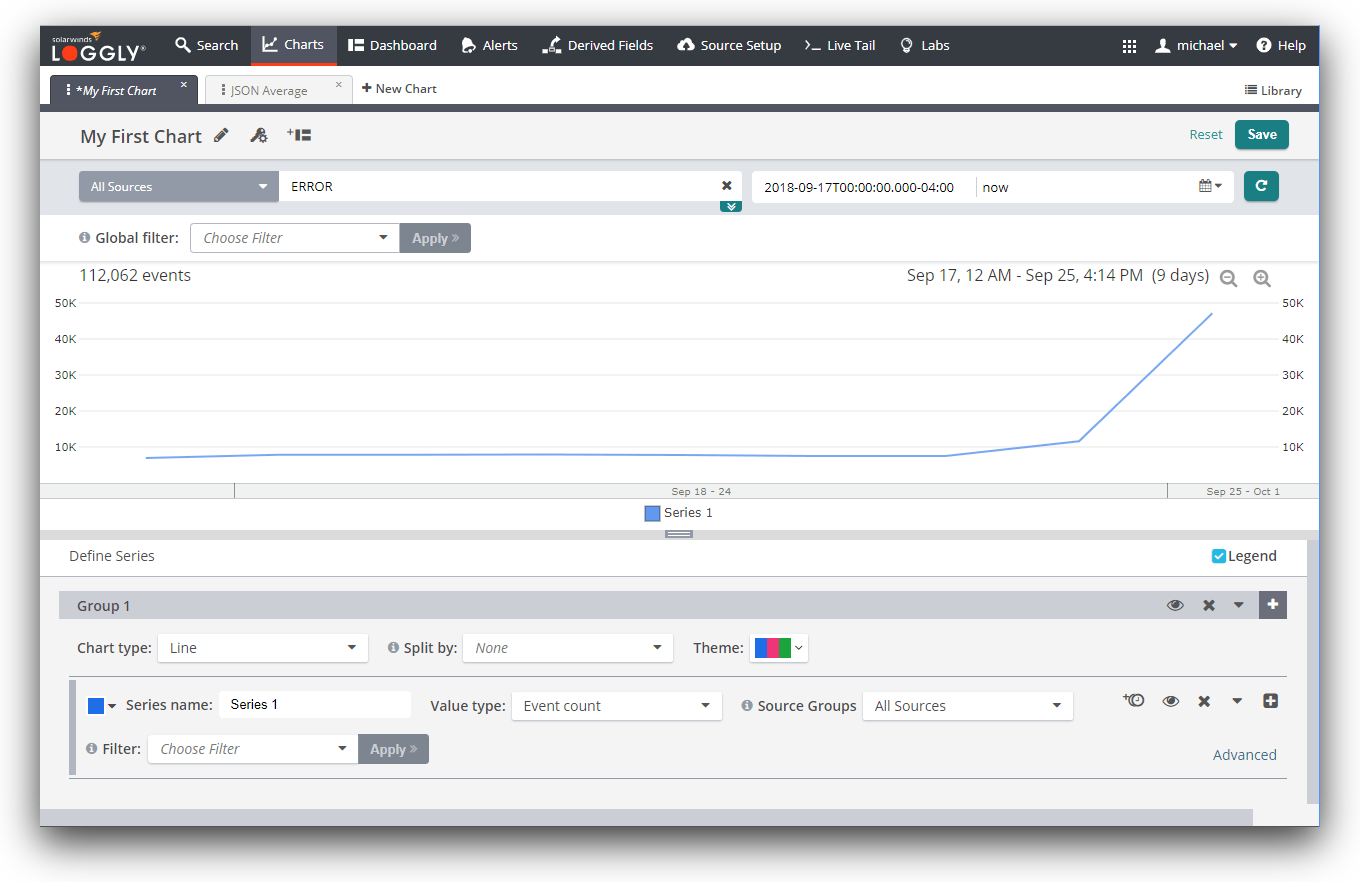
Creating a chart in Loggly can be very simple. From the Charts page, click the “New Chart” button. This will prompt you to name your new chart. Give it any name you want (multiple users can have the same chart names without conflict), and then you’ll be able to set up filters for your chart. Below, we are searching for errors from our test application. You can choose from a variety of chart types including Line, Area, Column, Point, Bar, and more.
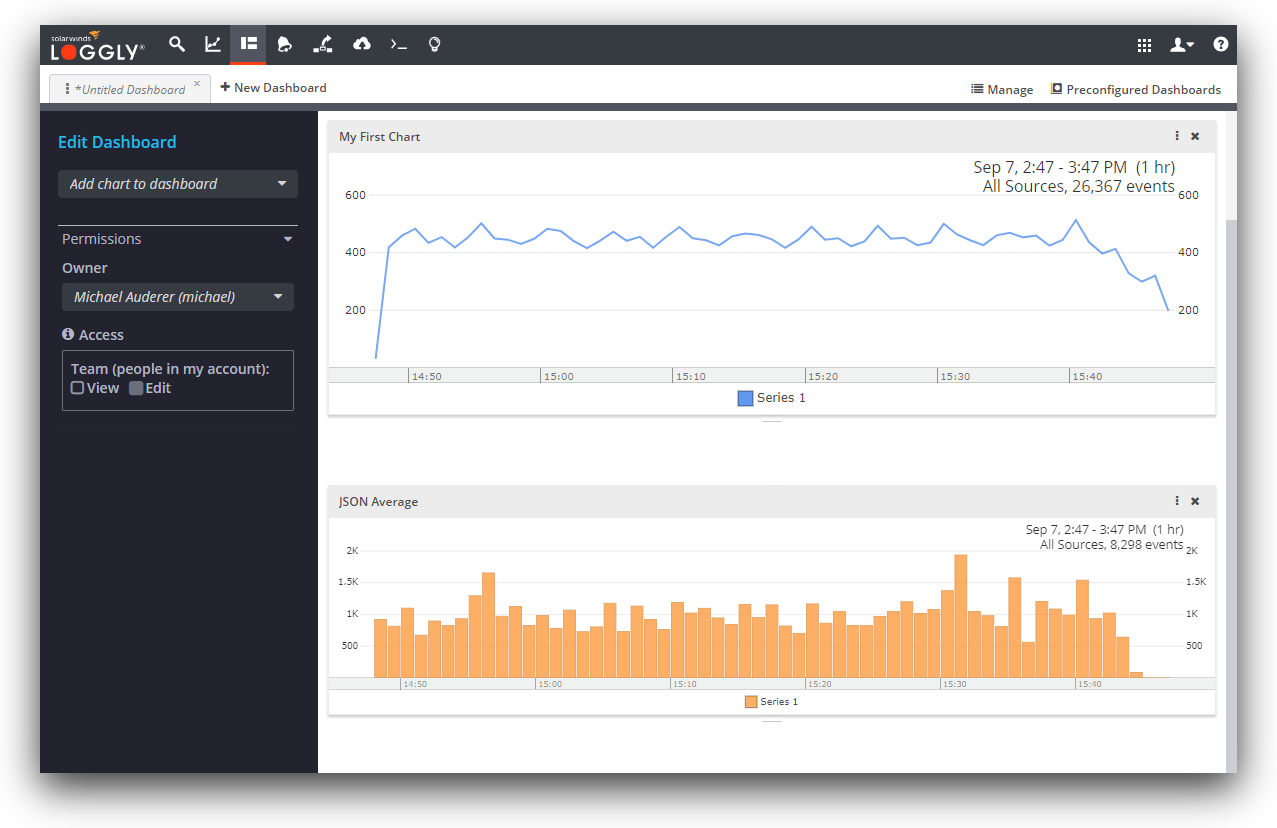
Once you create your chart and choose filters for it, you can optionally add the chart to your dashboard. Simply go to your Dashboard page, choose a dashboard or create a new one, and then in the left column, select “Add chart to dashboard.” You can create multiple dashboards with multiple charts for a powerful, on-demand display of all your reporting.
Creating an Error Alert
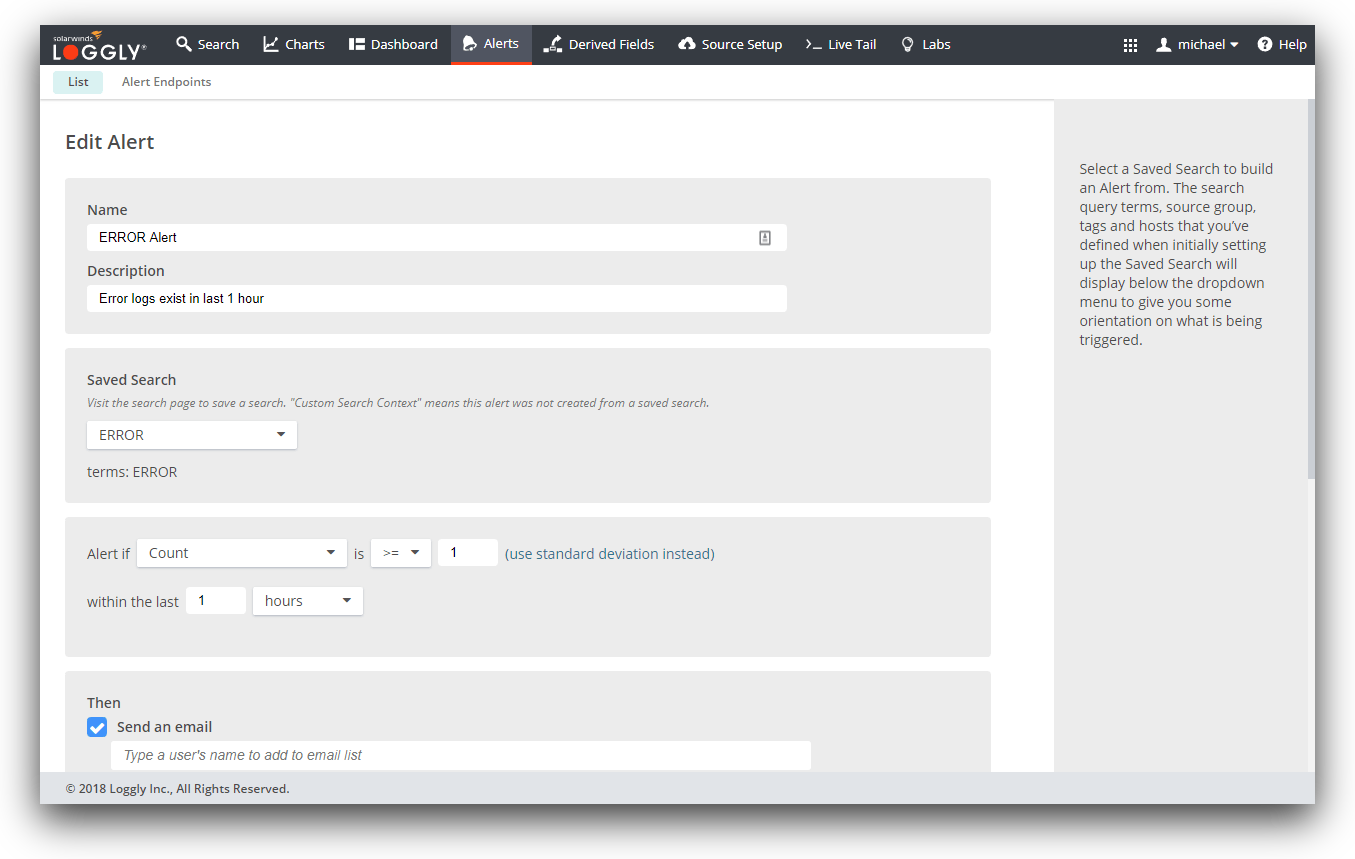
Loggly also makes it easy to set up alerts. When errors are occurring, it’s essential to find out as soon as possible, before you find out from an angry user. From the Alerts page, click the New Alert button and fill out the details. You can select a Saved Search or one of the default options such as “Web Server Client Errors”. Then, select the criteria to send an alert. For example, you can send an alert if there are more than 10 errors within an hour. Once set up properly, the alerts from Loggly let you rest easy, knowing your team will be alerted right away if a serious problem is impacting your users.
Logging is truly one of the most useful tools for developing and maintaining a successful app with an excellent user experience. Maintaining a great reputation with your users is essential for the growth of your app, and despite not yet being a large part of front-end culture, client-side logging is a fantastic way to understand what your users are experiencing.
By using remote logging with JSON logs, we can create a robust database of searchable and filtered logs. There are a few solutions to help us out with this, but an easy way is to use SolarWinds Loggly to receive logging, charts, analytics, alerts, and many other built-in features. All it takes is to configure a standard logging library to send to Loggly. Then, you’ll be well on your way to providing a better and more consistent user experience.
The Loggly and SolarWinds trademarks, service marks, and logos are the exclusive property of SolarWinds Worldwide, LLC or its affiliates. All other trademarks are the property of their respective owners.

Michael Auderer