Monitoring microservices: three ways to overcome the biggest challenges
Debugging and monitoring of microservices is not a trivial problem but a quite challenging one. I use the word challenging on purpose: There is no silver bullet for this. There is no single tool that you can install that works like magic. Fortunately, there are some practices that can help you.
Microservices in a Nutshell
In short, the microservice architectural style is an approach to developing a single application as a suite of small services, each running in its own process and communicating with lightweight mechanisms, often an HTTP resource API. —Martin Fowler
You can think of microservices like this:
- A number of services expose their APIs.
- They communicate with each other and the outside world.
A typical microservices topology could look like this:
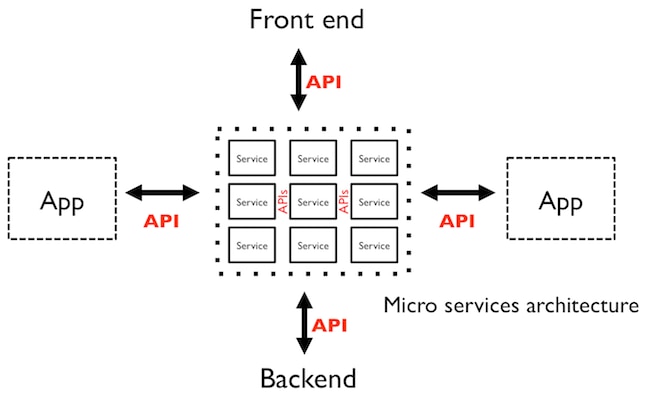
Source: Apigee Blog
In the example above, there are nine small services communicating with each other, and they expose four interfaces for different applications, for the front end and for the back end.
What Can Be a Microservice?
A microservice can be anything, that does one thing, but one thing well.
Each program does one thing well. —Unix Philosophy
Good candidates for microservices include:
- Authentication service
- Email sending
- Image resizing
- HTTP APIs for given resource types
Microservice Communication Types
When microservices communicate with each other, the two most common approaches are via HTTP and via messages.
Synchronous via HTTP
Microservices can expose HTTP endpoints so that other services can use their services.
But why HTTP? HTTP is the de facto, standard way of information exchange. Every language has some HTTP client (yes, you can write your microservices using different languages). We have the toolset to scale it; no need to reinvent the wheel. Have I mentioned that it is stateless as well?
Asynchronous via Queues/Messages
Another way for microservices to communicate with each other is to use messaging queues like RabbitMQ or ZeroMQ. This way of communication is extremely useful when talking about long-running worker tasks or mass processing. A good example of this is sending massive amount of emails—when an email has to be sent out it will be put into a queue, and the email microservice will process it and send it out.
Adding Request IDs Facilitates Microservice Debugging
If you move from a monolithic application to microservices, one of the biggest challenges you will face is the lack of stack traces through services.
What happens if one of your microservices in your infrastructure starts throwing stack traces? Wouldn’t it be great if you could trace it back to the origin of that request and play it back to see what happened? To be able to do that you have to assign a Request ID to each of your requests and log them. Since your microservices should be stateless, it should be easy to play back the whole request through your infrastructure, assuming that you record everything.
This approach solves another problem as well: You can have your services implemented in as many programming languages as you would like, and you will still have this playback ability.
Logging Challenges with Microservices
So far so good. You are logging your requests with IDs, but you still have to interpret them in some way. To do so you have to push your logs to a centralized logging application like Loggly.
Almost every language has a client already written and ready to be used with Loggly—not just the clients but also plug-ins for the most common logging libraries (for example, winston-loggly or bunyan-loggly for Node.js).
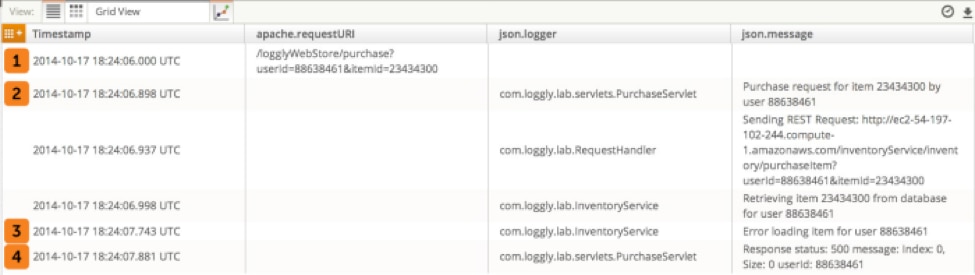
You can use the Request ID to trace a transaction through your logs. This blog post shows you how to do it with Loggly.
You can use log metrics to monitor your microservices. However, a display like this is really useful if you want to display throughput:
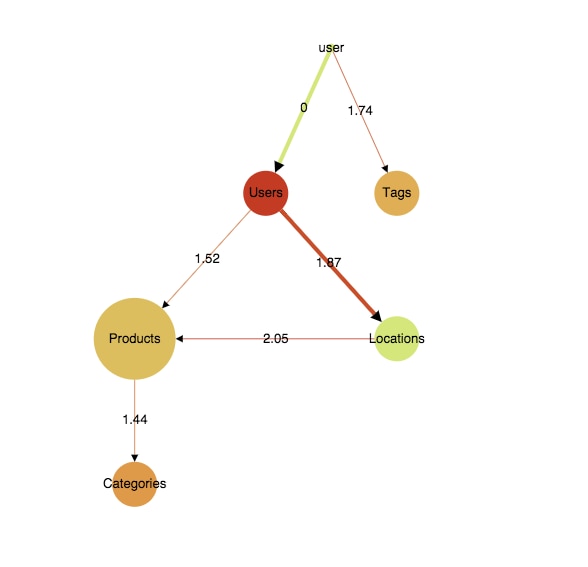
This shows five microservices (Users, Tags, Products, Locations, Categories) communicating with each other—the thicker the link the bigger the throughput is. The colors are for showing response times for each service—green means latency is under a given threshold.
Microservice Performance: How to Detect Bottlenecks
Detecting bottlenecks is not easy. Let’s say you have a request that takes 106ms to complete—where to look for clues?
Tools like New Relic made things easier, but they are not the best fit for microservices. When I take a look at a diagram, I want to see instantly what is taking so long.
One thing that can help is to be able to inspect individual transactions and see what is going on. The image below shows Google’s Cloud Trace in action, showing how the 106ms adds up for the /add_point endpoint. Basically, Cloud Trace provides distributed stack traces.
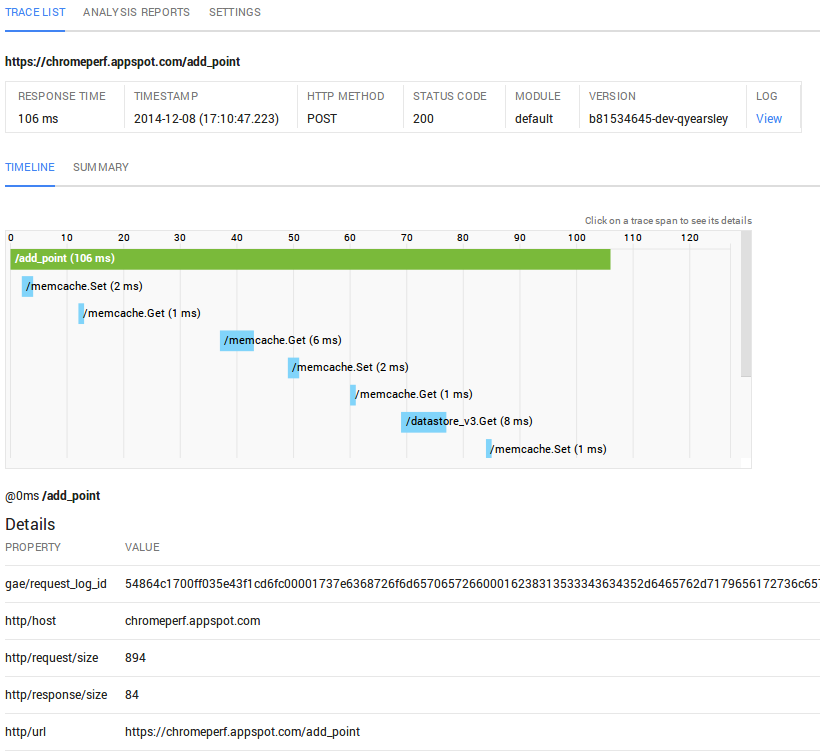
Sadly, it is available only in the Google Cloud for RPCs (Remote Procedure Call).
Alerting
If something goes wrong, you have be notified instantly. Many of the services we have discussed, including Loggly, offer alerting capabilities. You can set PagerDuty or other webhook-compatible notification services as the endpoint for Loggly alerts as well as others. In PagerDuty, you can set escalation processes and ask for alerts like Push Notifications, SMS, or even phone calls.
Solve Them All!
At RisingStack, we faced all these issues, so we decided to build a tool that saves you a lot of time in your own infrastructure. This will be open sourced soon, first supporting applications built with Node.js, with support for other languages in the pipeline. With this tool, you will have the ability to take a high-level view of your infrastructure and see the throughputs for each microservice as well as the latencies. Also, you will be able to trace individual requests through microservices — distributed tracing.
Until that, check out the Top 5 Advantages of the Microservices Pattern for more!
Gergely is the co-founder of RisingStack, a Node.js consulting, training, and development company. He is the organizer of Nodebp, the Hungarian Node.js user group, and he co-organizes JSConf Budapest. Follow him on Twitter: @nthgergo
The Loggly and SolarWinds trademarks, service marks, and logos are the exclusive property of SolarWinds Worldwide, LLC or its affiliates. All other trademarks are the property of their respective owners.

Gergely Nemeth