New Automated Log Parsing: Linux Auth Logs, MySQL Slow Query Logs, Nginx, and Much More!
One of the most important capabilities that sets Loggly apart from other log management vendors is our approach to parsing your log data. Loggly automatically parses, catalogs, and analyzes your data when we receive it. Other cloud-based vendors require you to configure parsing yourself and do parsing at search time, which makes your search results slower. Loggly gives you faster results with Dynamic Fields™, which:
- Visually expose what’s common and what’s unusual
- Make your logs much faster and easier to read
- Offer one-click drill-down to the source of problems
At Loggly, we’re always looking for ways to improve our automated parsing capabilities so that more of our customers’ logs can benefit from Field Explorer and other Loggly features. In this post, I’ll give updates on some changes we have made over the past several weeks.
New Log Types
Linux Authentication Logs
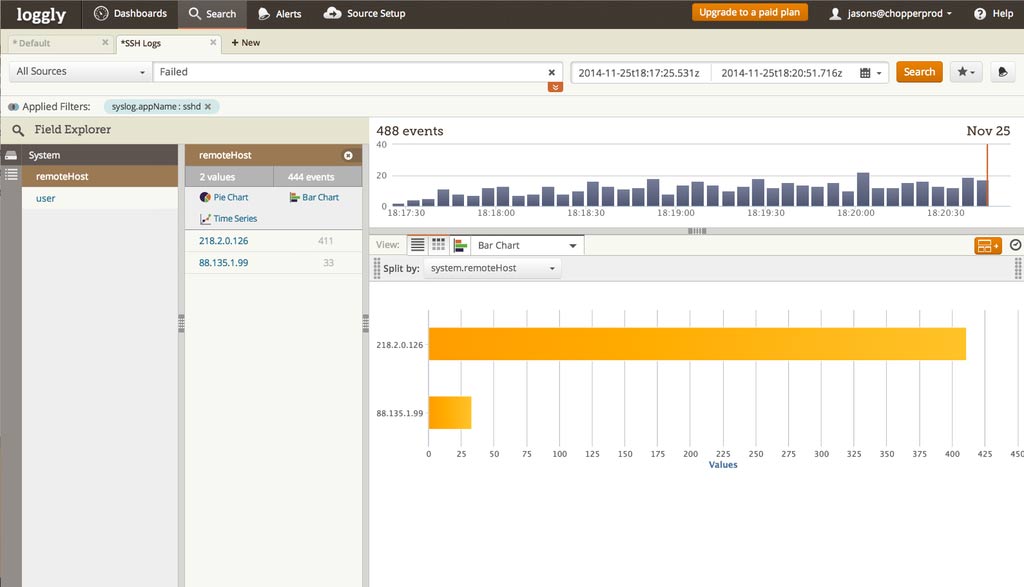
Loggly now extracts fields from the Pluggable Authentication Module (PAM). This includes login information from ssh, sudo, and more. You can use this data to see who might be scanning or trying to hack into your system, and set alerts for key events. Loggly extracts user IDs, IP addresses, and login failure messages. They are available under the “system” log type in Field Explorer.
For example, with this new capability you can see which IP addresses are generating the most failed root login attempts. If these IPs are not part of your organization, you can block them in your firewall or security groups.
MySQL Slow Query Logs
For MySQL, Loggly has added slow query log parsing. With Field Explorer and alerting, we now give you more timely, actionable visibility into how many rows were examined, how long it took to process queries, and whether queries were blocked. You can use these slow query log values to plot time-series charts with Loggly’s Trends feature so you can quickly see changes over time. In addition, MySQL slow query log parsing will allow you to use the numerics range search capability to look for (and alert on) specific ranges of values, for example to trigger an alert whenever a query takes over one second.
HTTP Headers
With HTTP headers, Loggly parses out the content-type as contentType and X-Forwarded-Form, which gets converted to the clientHost field in Loggly. This is another way to which hosts are sending logs using our HTTP API. It’s especially useful if you are sending from specific servers or if you have deployed Loggly in a client-installed application. In the latter case, you’ll be able to see the IP address of the customer using your installed software (and filter on that address in Field Explorer). This requires a logging library to set this headers, and we are adding support to the most popular ones including Java, Node.JS and .NET. The feature doesn’t yet support JavaScript or tracking pixels, which will be coming in a later release.
Improved Log Types
Apache and Nginx
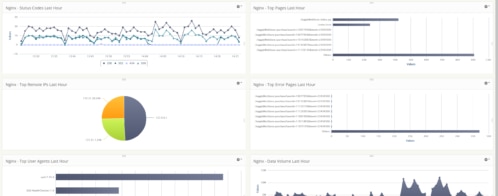
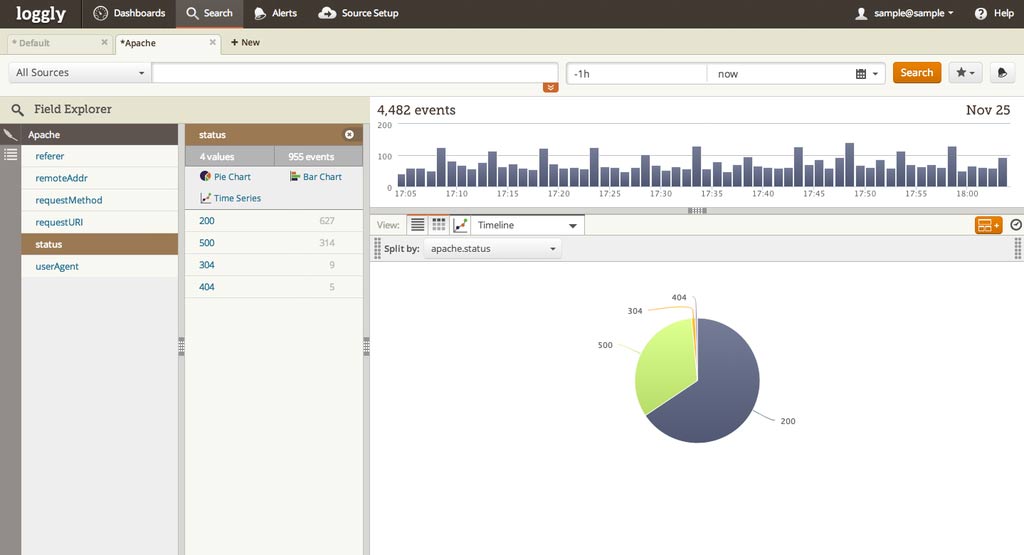
Loggly’s automated parsing now has support for expanded Apache log formats. You can choose from a variety of formats; there is a list in our documentation. Since Nginx has gained popularity recently—especially with large sites—we have also added support for new Nginx log types in Field Explorer.
For example, you can now quickly generate a pie chart of your Apache status codes. If you have too many 500 errors, you can drill down in Field Explorer to troubleshoot the problem. Additionally, while we currently parse Apache response times, we will soon deploy an update allowing us to parse Nginx response times as well.
Heroku
If you use Loggly with Heroku, be sure to check out our updated documentation on Heroku logs. Using syslog for log transmission, Loggly is able to extract the name of the component such as web dyno, worker, or something else. We also extract the name of the dyno.
MongoDB
Loggly extracts the Mongo module and timestamp from MongoDB logs. (For more details on the use cases, read Hector Angulo’s blog post from last year.) We have now updated the timestamp field so that it supports two common timestamp formats.
PHP
If you’re sending PHP logs via syslog, Loggly parses the method, level, timestamp and message from PHP logs.
Custom Parsing
If you’re interested in doing custom parsing with Loggly, we have added some useful links to our documentation page. You’ll have step-by-step instructions on how to implement custom parsing using Fluentd, Logstash, Rsyslog, and Syslog-ng.
Bookmark the Automated Parsing Documentation Page
If you haven’t done so already, you should bookmark the Loggly automated parsing documentation page since it’s a handy reference for what Loggly parses. Even if you’re just starting out with Loggly, you’ll get more out of your logs by understanding this important (and differentiating) Loggly capability.
The Loggly and SolarWinds trademarks, service marks, and logos are the exclusive property of SolarWinds Worldwide, LLC or its affiliates. All other trademarks are the property of their respective owners.

Jason Skowronski