Simple OS monitoring for Node.js with os-monitor and Loggly
Introduction
Keeping track of your code is not the only thing to worry about when running a Node.js project; you need to watch the underlying system that runs your project as well! In this blog post, we’ll demonstrate how to monitor and gather basic information about the resource usage of the system your app is running on, such as load average (on UNIX operating systems) and free memory available, using os-monitor with the Loggly client module for Node.js.
Audience and Scope
This article assumes that you have a working knowledge of JavaScript, Node.js, and dealing with NPM packages. Knowledge of Git and cloning from GitHub is useful if you want to pull a copy of our example project. You’ll also need to know how to run Node.js scripts such as we demonstrate below if you want them to stay active over time using a tool such as forever, nodemon or pm2. You can implement os-monitor as part of your existing Node.js project, or create a small stand-alone script. Our examples will show the latter to keep things simple.
Environment
The examples given in this article will assume a *NIX operating system (such as CentOS, FreeBSD, Solaris, Ubuntu, or the like). Of course, you’ll need to have Node.js/NPM on your system. For our examples, we’ll use an Ubuntu 15.04 x64 droplet on DigitalOcean using nvm with Node.js v0.12.7:
| ~ # which npm /root/.nvm/versions/node/v0.12.7/bin/npm ~ # npm –version 2.11.3~ # which node /root/.nvm/versions/node/v0.12.7/bin/node ~ # node –version v0.12.7~ # mkdir -p ~/bin ~ # cd ~/bin ~/bin # touch os-monitor.js ~/bin # chmod +x os-monitor.js ~/bin # emacs os-monitor.js———————————————————————————– | edit your ~/bin/os-monitor.js file |
Example Code
If you’d like to play directly with the code examples given in this article, you may clone our example repository from GitHub: https://github.com/macdaddy/loggly-blog-node-os-monitor
You can run the project by running `npm install` in its root directory on your system, and then `node os-monitor.js` to begin execution (the `back-ticks` indicate the text of the commands to be run on your terminal and should not be entered as part of the command). See the project’s README for the latest instructions.
Configuration
To begin, let’s create a file called os-monitor.js in a folder called ~/bin/ and enter the following code:
| var loggly = require(‘loggly’), monitor = require(‘os-monitor’);var client = loggly.createClient({ token: “your-really-long-input-token”, subdomain: “your-subdomain”, auth: { username: “your-username”, password: “your-password” }, json: true // to send logs using the JSON format }); |
This creates an instance of both the Loggly client and the os-monitor client when executed by node, configures the Loggly client with our authentication to Loggly’s server, and specifies that our logs will be sent in the JSON format. See the section Loggly.com Setup below for more information on setting up your account and obtaining your token.
Using os-monitor
We can use the os-monitor module as an event emitter and listen to given events. In the following example, we are starting up the monitor with a cycle interval of 5 seconds (5000 ms). We will observe one-minute load averages and free memory:
| monitor.start({ delay: monitor.seconds(5), critical1: 1, // will alert when 1 minute load average is higher than value 1 freemem: 0.2 // will alert when free memory left is under 20% of total memory }); // define our event handler // here, add optional data to event object // log to Loggly // observing 1 minute load average and free memory events // observing monitor events, which always happen on every cycle |
Capturing Events
Using the module as a data stream, we can capture all events like this:
| monitor.start({ delay: monitor.seconds(5), critical1: 1, freemem: 0.2, stream: true // use as readable data stream });// observing all streaming events (in this case: ‘monitor’, ‘loadavg1’, ‘freemem’) // using readable stream ‘data’ event monitor.on(‘data’, function( buf ){ // get event object from Buffer var event = JSON.parse( buf.toString() ); // here, add optional data to event object event.formattedDate = new Date(event.timestamp * 1000).toString(); // log to Loggly }); |
General Usage
We can also plug a streaming monitor object into any writeable data stream:
| monitor.start({ stream: true });// write to STDOUT monitor.pipe(process.stdout); // write to a file monitor.pipe(logFile);console.log(“os-monitor.js is now running…”); // So we can see what’s up |
Running our code
Let’s review a final checklist to be sure we’re good to go:
- Did we `npm install` the os-monitor and Loggly packages?
- Did we substitute our token and auth info for our Loggly.com account?
(See the section “Loggly.com Setup” below for help with that part.) - Are we happy with the filenames and configuration options we’ve set in our code?
Great! All that remains is to execute our code with node:
| ~/bin # node os-monitor.js os-monitor.js is now running… |
You may let this run for a while to capture events and let data get sent off to Loggly for testing, but eventually you’ll want to run things in a more long-term fashion. You can configure pm2 or another process manager to keep this script running continuously, or simply integrate this code into your Node.js project and allow it to run continuously as part of your existing project.
Note that Loggly’s service does not yet handle array data for trend graphs. Memory usage and other metrics can be easily graphed, as well as event counts.
Loggly.com Setup
To make use of the data sent to Loggly.com through the Node.js Loggly client module, make sure you have at least a free Loggly account and have replaced the placeholder text with your account’s details.
If you do not have any data already configured on your Loggly.com account, you may do so from your dashboard by clicking “Add some data to take a spin!” This will take you to “Source Setup” where you can configure your data source(s).
We don’t need to use the web interface to set anything up; we’re just interested in getting our Customer Token. Click on “Customer Tokens” to find and/or create the token you need to use:
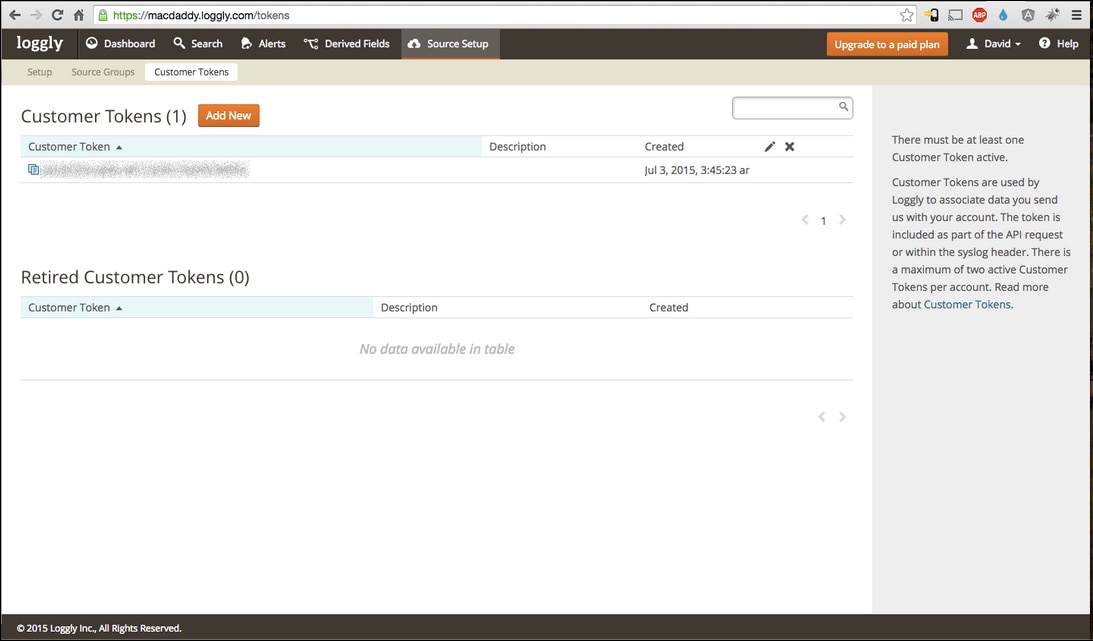
Enter this token into your os-monitor.js script, along with the same username and password you use to log in to Loggly.com. Set your subdomain to the subdomain you chose when you signed up for your Loggly.com account, so if your Loggly.com subdomain is https://macdaddy.loggly.com/, set your subdomain to “macdaddy”.
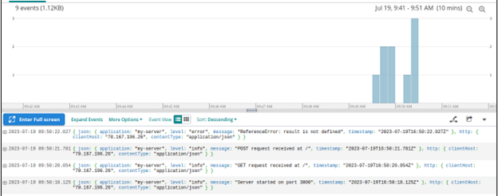
With your os-monitor.js script running under node, data will be sent to Loggly.com’s server and you’ll see it begin to appear on your dashboard after a few minutes.
Over time, the data will continue to be pushed to Loggly.com, and you’ll have a powerful reporting interface to inspect and supervise your server resources. The most useful trends which may be observed might include spikes in CPU/RAM usage, surges in resource usage, and sudden drops in usage. Cross-reference with traffic patterns and knowledge of when server backups and other cron jobs are running, and you’ll have a solid picture of your project top-to-bottom.

Conclusion
We’ve looked at installation, setup, and configuration of os-monitor to keep an eye on your system and wired it up to Loggly. Keeping an eye on your system’s resources can be a powerful tool in your arsenal as you manage your projects and, fortunately, tools such as os-monitor and Loggly help make it easy!
Want to read more? Check out Laurent Fortin’s os-monitor module page on npmjs.com.
The Loggly and SolarWinds trademarks, service marks, and logos are the exclusive property of SolarWinds Worldwide, LLC or its affiliates. All other trademarks are the property of their respective owners.

David Liedle