Web Application Logging and Analytics Using SolarWinds Loggly
Application logs provide a great deal of insight, such as critical errors ruining user experiences and active security attacks requiring immediate SRE or DevOps attention. Without logs, you have no idea how users interact with your application or how well it’s running. One issue for DevOps professionals is how to properly implement a full logging solution. It’s not enough to have logs; you also need a way to manage and analyze those logs to monitor application activity and performance.
Challenges of monitoring web applications
Once you know you need logs, the next steps are understanding the events that should be logged, where to record these events and store them, and data that you can reasonably exclude. You can create your own logs using back-end application code, but you could save some time by using the logs available in common web server software such as Apache or NGINX.
When you design your logging solution, you must overcome three main challenges. These challenges aren’t impenetrable obstacles, but they present hurdles for DevOps professionals during the design phase of your solution.
1. Events: What events should you log? Software developers should have error handling baked into the application code, but error handling presents a user-friendly way to provide feedback to users only when something goes wrong. Logging gives developers and other DevOps professionals a way to understand what went wrong and provides insight into how to fix it.
Security events are also critical issues that should be logged. Security events provide insight into application misuse and ongoing attacks that could later lead to a data breach theft. By monitoring these events, DevOps professionals can use analyzed patterns to determine security policies when detecting suspicious activity.
Other events that can be logged include anti-automation detection, data exports, shopping cart abandonment, compliance issues, and file modifications to name a few. With multiple applications, the challenge is not only logging these events but keeping track of the data source associated with them.
For a list of events that you should log, OWASP has a good cheat sheet of events and their data sources.
2. Storage: Logs require massive storage space, especially when you have a large website or several applications. After logging thousands of events for several months, you need a way to archive them. For compliance reasons, you can’t just destroy log files without a way to retrieve them for auditing purposes. This challenge requires a way to securely store logs that doesn’t fill web server disk capacity, but can easily be retrieved in case of an audit.
3. Excluding data: You don’t need to track every event, but excluding the wrong type of event can make analysis and research into issues difficult for DevOps professionals. Excluding unneeded data saves storage space, but excluding important events can leave your developers blind to what could be a poor user experience and even revenue-impacting application failures. For this reason, designing a solution that gives an extensive overview of application activity without logging unnecessary data is one of the most difficult challenges for DevOps.
Overview of common web server logs
Most web servers use a standardized format to log events. Apache writes access and error logs to the local server storage drive, but both log files are separated, and each is given a name to differentiate them. Apache separates events into two separate categories: error logs and access logs.
Errors: stored as error_log or error.log depending on your operating system.
User access: stored as access_log or access.log depending on your operating system.
The logs are stored as plain text using a specific format. This standardized format is what makes them easy to parse and read. Here is an example of an error log event:
[Wed Oct 11 14:32:52 2018] [error] [client 127.0.0.1] client denied by server configuration: /export/home/live/ap/htdocs/test
As you can see, each event is date- and time-stamped according to the server’s system time. The second section is the log level. Apache has several log levels that indicate the type of error recorded. The third section is the client IP address, which can be used to determine if a certain bot or client machine should be blocked from further activity. And the final part of the log is the actual error message. In this example, the client at IP 127.0.0.1 was denied access to the web applications.
Apache access logs display information related to requests processed by the server. For every web page users request on your web application, a log of the request is stored in the access log. The access log has a similar format compared with the error log.
127.0.0.1 - httpuser [10/Oct/2018:13:55:36 -0700] "GET /apache_pb.gif HTTP/1.0" 200 2326
The IP address you see is the IP of the client, but you have the option of logging the hostname instead by turning on HostnameLookups. If the user is using a proxy, the proxy will sometimes send the true IP using the HTTP_VIA header. This can be used in your code to determine a user’s true IP address if the proxy is transparent.
The hyphen relates to RFC 1413, which provides a definition for identifying a user on a TCP connection. With anonymous web connections, this will always return “not found.” When this response is given, Apache logs a hyphen for that piece of information.
The third field is the username used for authentication. In this example, httpuser is used to authenticate web users. If this were a page that required authentication and the status code returned was 401, you shouldn’t trust this value because the user never authenticated and instead was rejected by security policies.
The date in the log file is the time and date when the user accessed the Apache resource.
The type of request—in this example GET—is displayed along with the page that was requested. If a user was submitting form data, this request would show as a POST request.
The 200 in this example is the status code returned by the server. 200 is “OK” and indicates that the user was able to access the web page. This number could be any one of the RFC status codes and can help identify bugs and issues in your web application.
The final number in this log is the size of the content returned to the user, excluding the response headers.
To learn more about logging in Apache, see The Ultimate Guide to Apache logging.
These single-line items are easy to understand, parse, and read, but now imagine having several applications with thousands of users accessing them each day. For larger organizations, millions of events could be logged each day and the challenge to parse, read, and analyze them can be overwhelming for any DevOps team. The more disorganized and fragmented the logs become, the higher the chance that someone will miss a critical event and the application will crash.
Monitoring web applications using Loggly
With the SolarWinds® Loggly® solution, these challenges and the administrative overhead of organizing logs are both solved. Loggly aggregates and displays events in real time, so your application is consistently monitored. Loggly even has nine pre-configured dashboards that display immediate, effective views of performance and usage of your various systems. DevOps can aggregate, monitor, and analyze events for a faster response to your most critical application issues.
Let’s say you have several web applications on different platforms such as IIS, Apache, and NGINX. You want to see Apache events logged only on a specific web server. You could dive into text files stored on the web server and read them line by line, or you could use Loggly and Apache-specific dashboards. The event viewer will help you perform a search based on terms and phrases to help you narrow down issues.
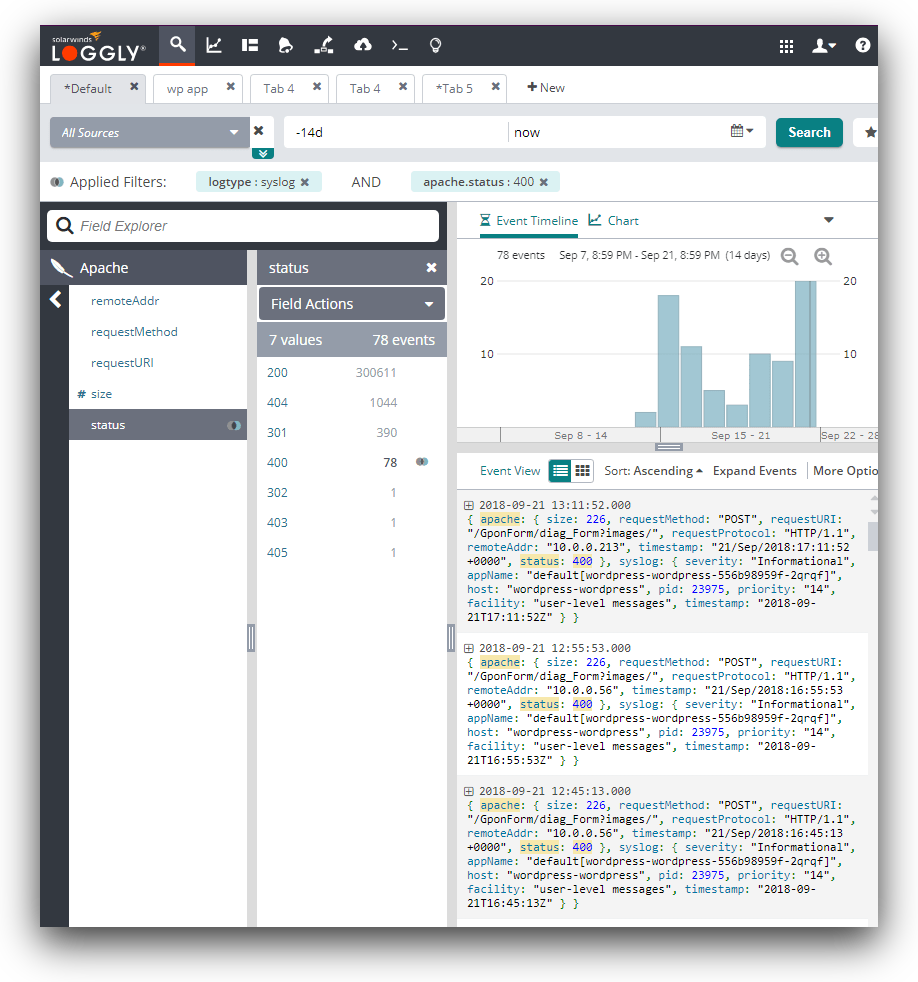
Below, we see a screenshot showing Loggly with search results for Apache logs. These events are real-time actions occurring on the Apache server and streamed to Loggly. They can be used to trace certain activity such as suspicious traffic or diagnosing an issue on a web application.

Use this view to get a quick count of events matching your search terms and a quick look at events that could lead to bigger issues. You can also search by IP, event name, file or page name, or the application name. The advantage of the event viewer of Loggly is that you can quickly search numerous log files without aggregating them manually or using inefficient, slow ways to go through them one by one. It saves time, especially when you have several web servers logging several different applications and you need to search all of them for one specific issue.
The Loggly Dynamic Field Explorer™ allows you to see all the fields parsed from Apache logs. You can then filter down on specific values of interest. For instance, you can filter on error status codes such as “400” to find bad requests coming into your server.
Using Loggly for analytics
Searching log files is good for a quick review for critical issues, but what if you need better insight into the trends of errors or metrics over time? The Loggly solution extends traditional log search features by giving you a much more flexible way to search and graph these errors. Because Apache and other web servers use common formatting, preconfigured fields are set up for you, and any searching and graphing can be done with a few clicks of your mouse button.
The preconfigured dashboards of Loggly are made for administrators who need a way to review application events for:
- Apache
- Amazon CloudWatch Metrics
- Amazon CloudTrail
- Amazon ELB
- Docker
- IIS
- MongoDB
- Linux
- NGINX
Apache logs can be sent to Loggly using syslog daemons such as rsyslog. After connecting the Apache web server to Loggly, you can create dashboards to monitor and analyze events in one location, or use the preconfigured Apache dashboard.
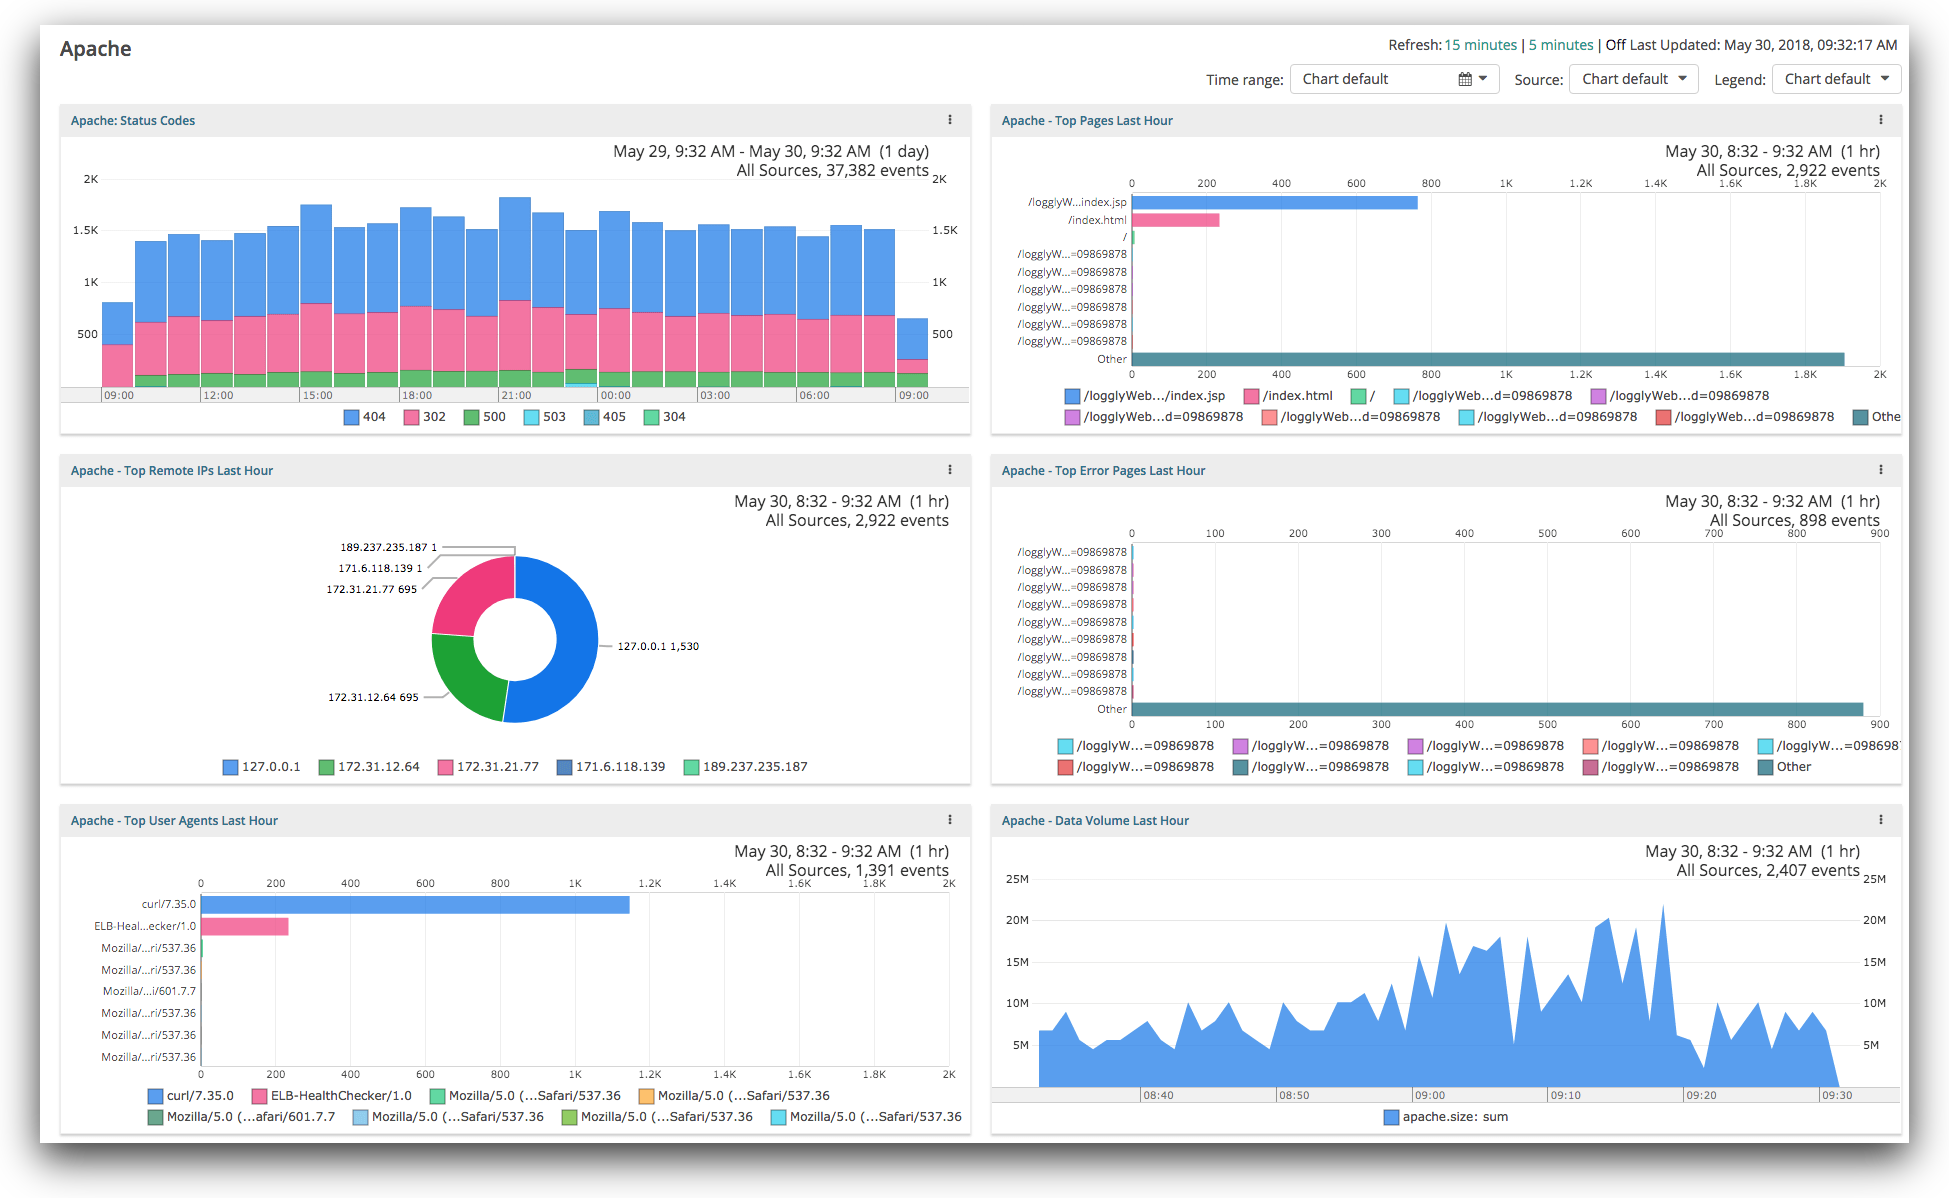
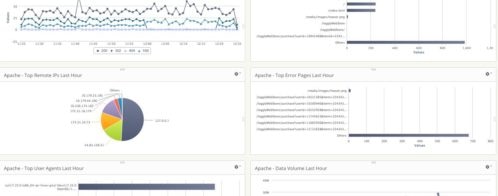
In the dashboard above, we can see several events in a visual format. Most important is the top-left corner, which displays the Apache status codes within the last hour. Loggly lets you review errors and events based on a time frame that you specify, so these graph time durations are dynamic based on your own settings. Other graphs include the top pages requested, remote IPs accessing your web application, top error pages, user agents, and your data volume. These graphs enable you to get a quick visual overview of the health of your system. You can also set alerts that will notify you when metrics exceed a certain threshold or exhibit anomalous behavior.
Conclusion
Whether you’re a developer looking for ways to better analyze application events or an SRE looking for a log aggregation solution for multiple web servers, SolarWinds provides an easy solution to link different server and application environments into one web-based view. Loggly makes it easier to search and analyze your logs. This can save you time troubleshooting problems, and help you deliver your web application with high reliability.
Sign up for a free trial on Loggly to get started.
The Loggly and SolarWinds trademarks, service marks, and logos are the exclusive property of SolarWinds Worldwide, LLC or its affiliates. All other trademarks are the property of their respective owners.

Jennifer Marsh